SBIN DOWN 7%, WHAT NEXT?
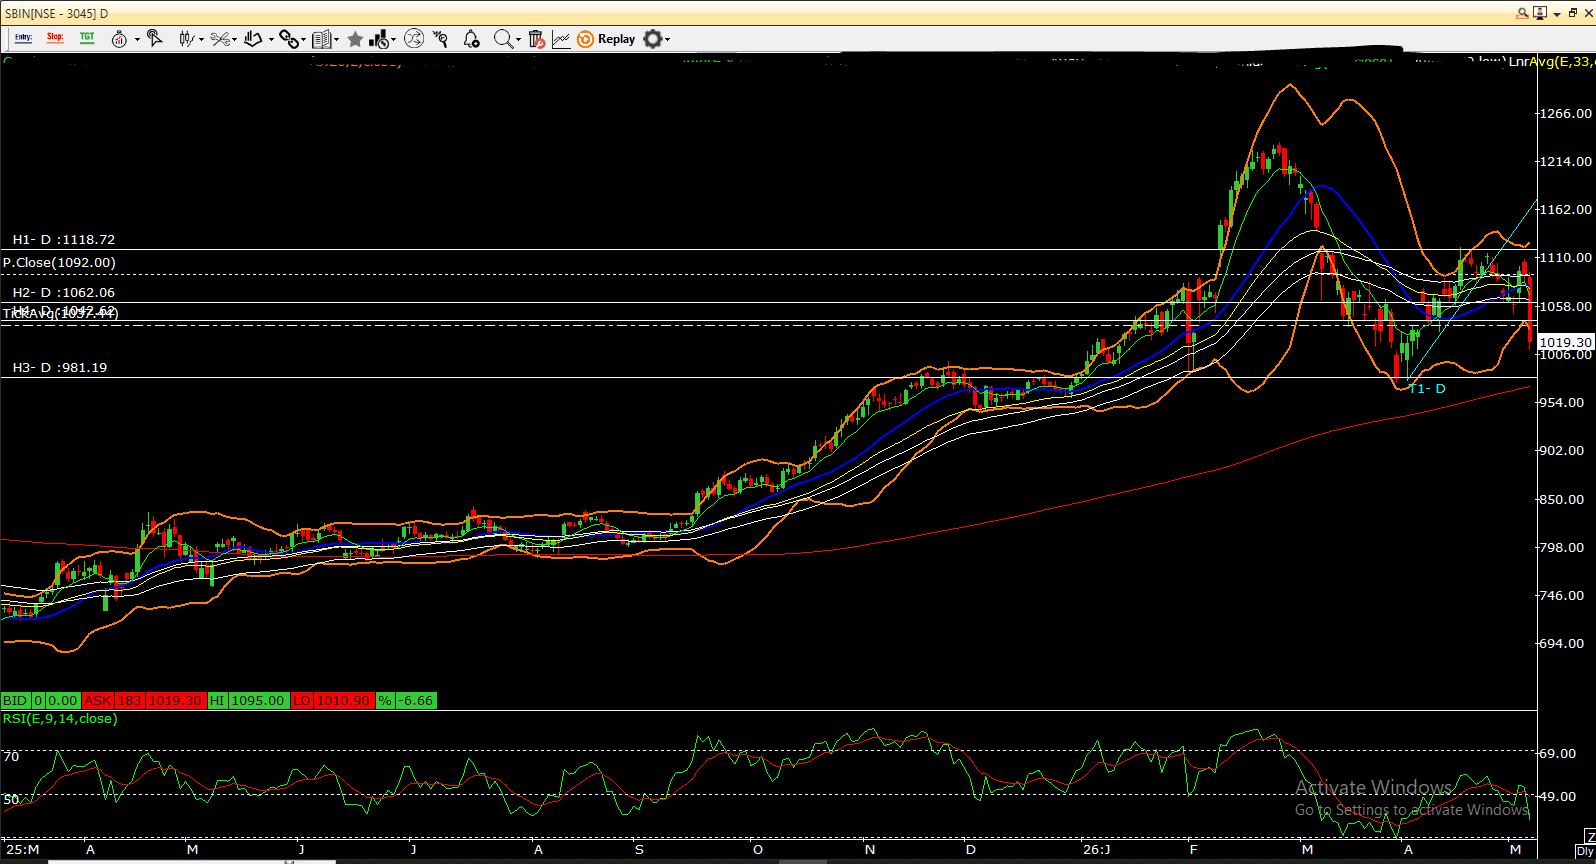
SBIN declined sharply by 6.66% after reporting Q4 results below market expectations. The stock had recently rallied to the 1215–1220 zone, but weak earnings and heavy profit booking triggered a steep correction, dragging the price down to around 1019.
From a technical perspective, the near-term structure has weakened considerably. SBI has slipped below its key short-term moving averages, while momentum indicators have also turned negative, reflecting cautious sentiment in the market.
The immediate support for the stock is placed near 1000, which remains a critical level to watch. As long as SBI holds above this zone, the stock may consolidate within the 1000–1060 range, with any recovery likely facing resistance near 1055–1065. A stronger trend reversal would require sustained trading above the 1090–1110 resistance band.
However, if the stock breaks decisively below 1000, further downside pressure could emerge, opening the possibility of a decline toward the 980 and 955 support levels.
Technical Outlook
Previous high zone: 1215–1220
Current price zone: 1019
Immediate support: 1000
Lower support levels: 980 / 955
Near-term resistance: 1060
Major resistance: 1090–1110
Overall, the long-term trend remains intact due to the rising 200-day moving average, but the short-term outlook has turned bearish following the earnings-led correction.