2 hours ago · SEBI Registration INH000019309
SEBI Registration INH000019309 · 2 hours ago
South Indian Bank Nears Key Resistance Breakout Zone
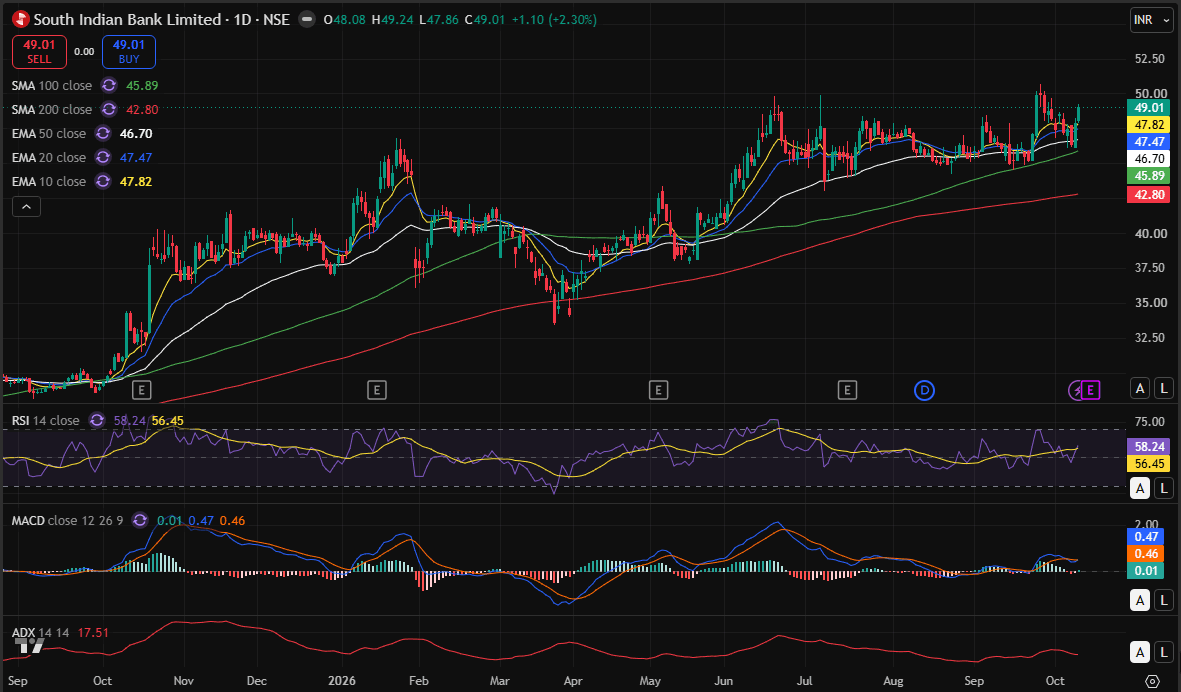
South Indian Bank is showing a positive technical structure on the daily chart, with the stock trading at ₹49.01 and sustaining above all major moving averages. The price is approaching the ₹50 resistance zone, which remains an important level to watch for a potential breakout.
The 10 EMA is at ₹47.82, the 20 EMA at ₹47.47, and the 50 EMA at ₹46.70. The 100 SMA at ₹45.89 and 200 SMA at ₹42.80 further support the broader bullish structure.
RSI is at 58.24, indicating positive momentum without entering the overbought zone. MACD is marginally positive, with the MACD line slightly above the signal line, suggesting that bullish momentum is attempting to strengthen. However, ADX at 17.51 indicates that trend strength remains relatively weak.
Key Levels: ₹48–₹47.50 is an important near-term support zone, while ₹50 is the immediate resistance. A sustained breakout above ₹50 could open the possibility of further upside towards ₹51–₹52. A breakdown below ₹47.50 may weaken the short-term structure.
My View: The overall trend remains positive, supported by the moving-average structure and RSI above 50. A decisive breakout above ₹50, supported by strong volume, would strengthen the bullish setup. Existing holders may monitor the resistance breakout and support levels for continuation or risk management.
Disclosure: I or my family members do not hold any shares of South Indian Bank at the time of writing. This article is for educational purposes and reflects technical analysis, not personalized investment advice.