1 hour ago · SEBI Registration INH000019309
SEBI Registration INH000019309 · 1 hour ago
TCS Breakout Alert: Bullish Reversal or Resistance Trap?
Tata Consultancy Services (TCS) has surged nearly 5%, bringing a major technical battle into focus. The chart suggests a potential double-bottom breakout, but can the stock sustain this momentum?
1. Double-Bottom Breakout
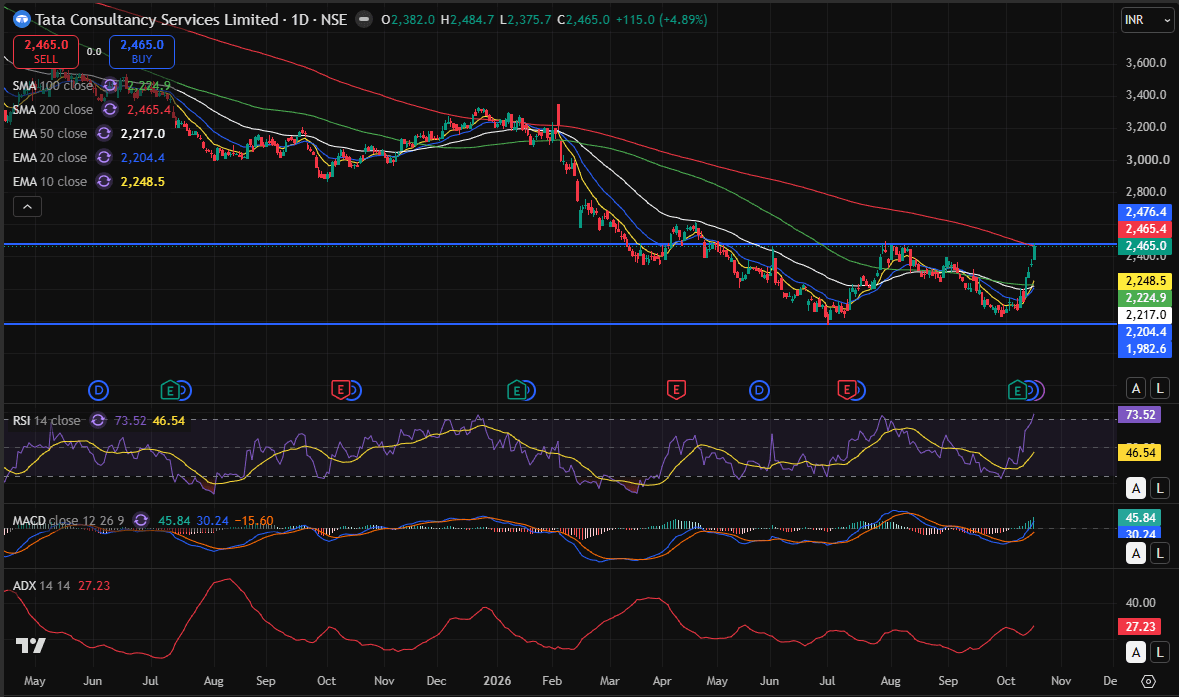
TCS appears to be forming a double-bottom pattern around the ₹2,050–2,100 zone. The stock has rebounded sharply towards the ₹2,465–2,480 neckline/resistance zone. A sustained close above this range could strengthen the bullish reversal setup.
2. 200 SMA: A Major Test
After nearly 10 months below the 200-day SMA, TCS is testing this long-term trend indicator around ₹2,465. A decisive breakout with strong volume could signal improving long-term sentiment. However, rejection here may trigger profit booking.
3. Moving Average Crossover
The 10 EMA has moved above the 20, 50 and 100-day moving averages, indicating improving short-term momentum. This is a bullish alignment, but the crossover alone does not confirm a sustained uptrend. Price acceptance above resistance is still crucial.
4. Momentum Indicators
RSI is near 73.5, showing strong buying momentum but also an overbought condition. MACD is turning positive, supporting the recovery, while ADX near 27 suggests a strengthening trend.
My View
TCS is at a crucial inflection point. A sustained breakout above ₹2,465–2,480, supported by volume, could open the door to further recovery. Failure to hold above this zone may lead to consolidation or a pullback towards the moving averages. Confirmation matters more than anticipation.
Disclosure: The analyst and his family do not have any position in the stock at the time of publication. This article is for educational purposes only and is not investment advice.