Technical Analysis Report: CG Power and Industrial Solutions Limited
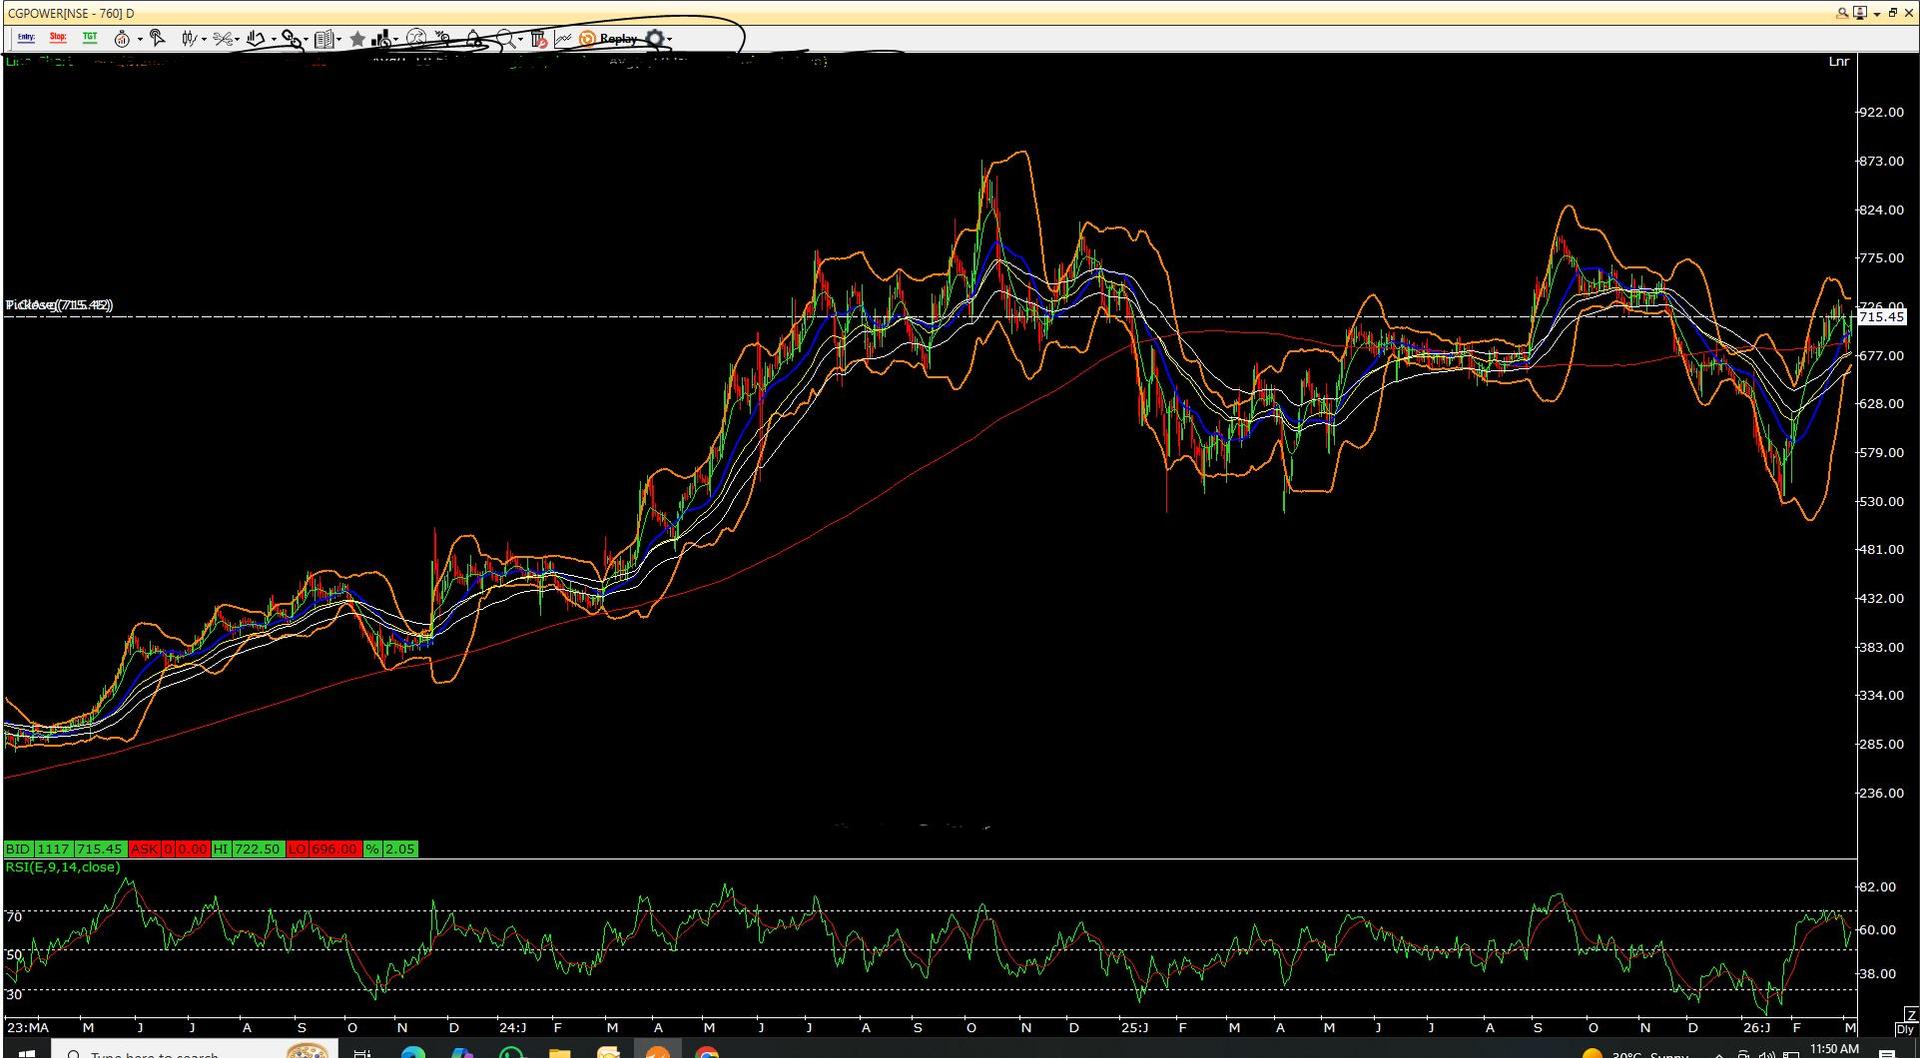
CG Power is showing signs of recovery after a corrective phase within its broader long-term uptrend. The stock earlier witnessed a strong rally and later moved into consolidation after reaching the ₹850 zone. Recent price action indicates renewed buying interest and improving momentum. From a trend perspective, the stock is trading near its long-term support region, with the 200-day moving average acting as an important base around the ₹660–₹680 zone. The rebound from the ₹530–₹560 demand area suggests that buyers are defending lower levels and the stock is attempting to rebuild bullish momentum. The short term exponential moving averages (8 EMA and 33 EMA) have started turning upward, and the price is currently trading around these averages. This indicates improving short-term momentum and suggests that the stock may attempt a gradual upward move if buying interest continues. Bollinger Band behavior shows that the stock recently bounced after touching the lower band during the correction phase, indicating earlier oversold pressure. The current movement toward the middle band suggests a recovery phase, and sustained strength could push the price toward the upper band. The RSI indicator has recovered from oversold levels and is now trading near the 60 zone, reflecting strengthening momentum. A sustained move above this level may support further upside in the stock. Key support levels are placed around ₹690–₹675, followed by a stronger support zone near ₹660–₹650. On the upside, immediate resistance is seen near ₹725–₹740. A breakout above this zone could open the path toward ₹770–₹780, while the major resistance remains near ₹820–₹850. Overall, the technical structure suggests that CG Power is attempting to regain upward momentum after consolidation, with key resistance and support levels likely to guide the next directional move.