📈 Technical Analysis Report: MUTHOOTFIN
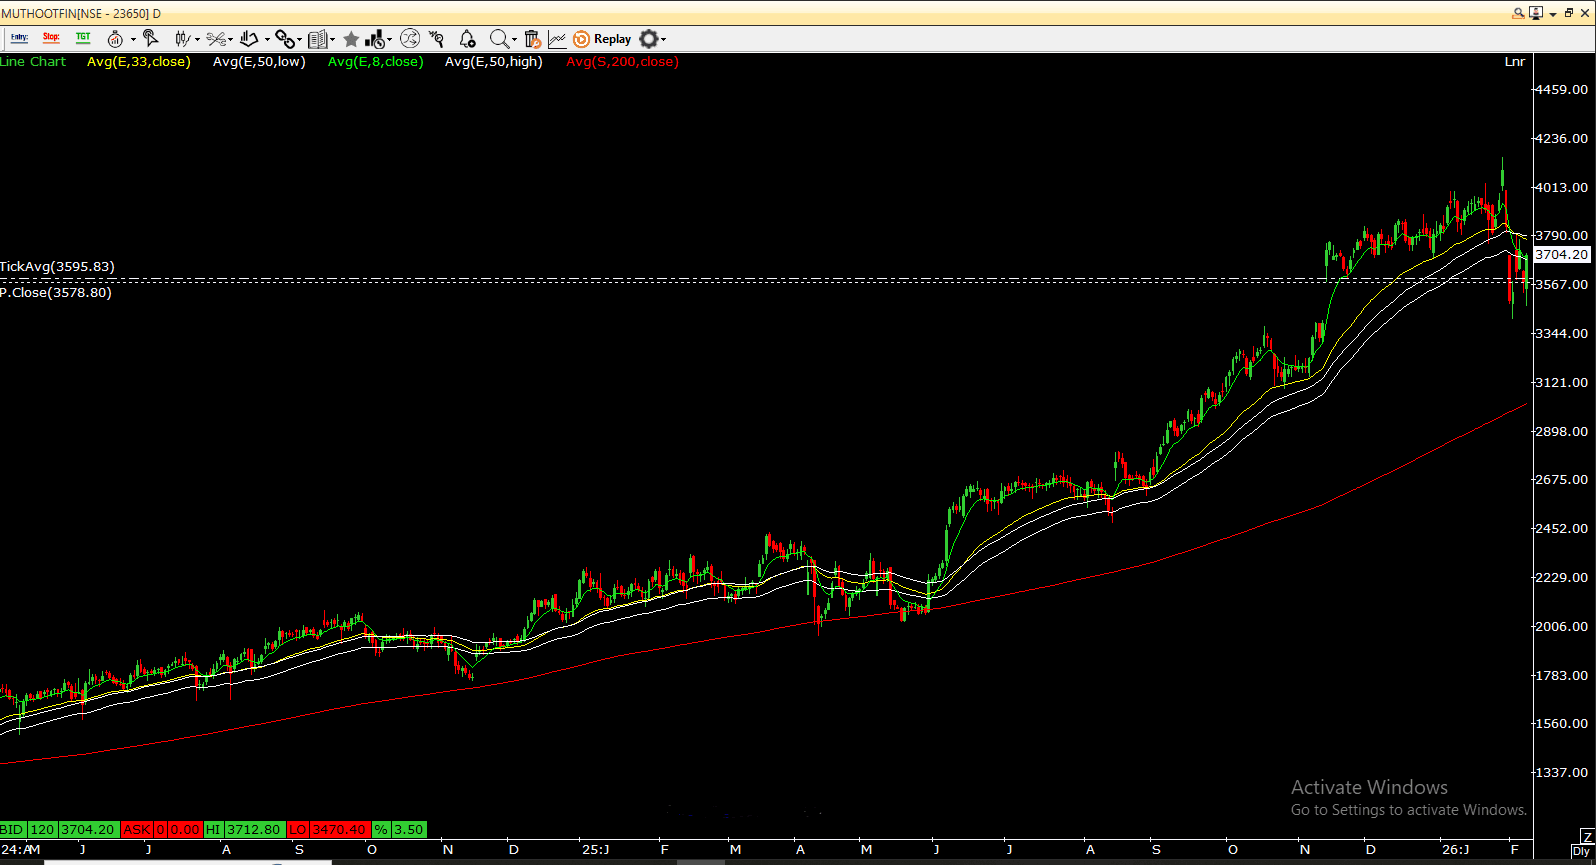
Current Price: ₹3,704.20 (Friday close)
Muthoot Finance continues to trade in a strong uptrend, characterized by higher highs and higher lows on the daily chart. Recently, the stock has taken support at a higher low, indicating sustained buying interest at lower levels.
🔹 Price Action & Chart Patterns
On the daily timeframe, the latest candle has formed a Bullish Engulfing pattern, a classic reversal signal suggesting a shift from short-term weakness to renewed upside momentum.
Additionally, a Double Bottom pattern is visible on the daily chart, further strengthening the bullish reversal case.
These patterns together indicate that the recent consolidation phase may be over, with the stock preparing for another upward leg.
🔹 Moving Averages Trend
The stock is trading well above the 200-day SMA, confirming a strong long-term uptrend.
A recent close above the 50-day EMA signals improvement in short- to medium-term momentum and supports continuation of the bullish trend.
🔹 Momentum Indicator (RSI)
The RSI has rebounded sharply from 35 and is now above 45, indicating a reversal from oversold territory.
This move in RSI supports the view that downside momentum has weakened and buyers are regaining control.
🔹 Trade Strategy (Positional)
Buy Above: ₹3,712.80 (Friday’s high)
Target 1: ₹3,820
Target 2: ₹4,000 (on sustained breakout above ₹3,820)
Follow Stoploss - ₹3550
🔹 Conclusion
The confluence of bullish price patterns, supportive moving averages, and recovering RSI momentum suggests that Muthoot Finance remains structurally strong. A breakout above ₹3,712.80 could open the door for a fresh upside move toward ₹3,820 and potentially ₹4,000 in the coming sessions.