Technical Research Report – Oil India Ltd
Stock: Oil India
Timeframe: Daily Chart
View: Bullish
Technical Overview:
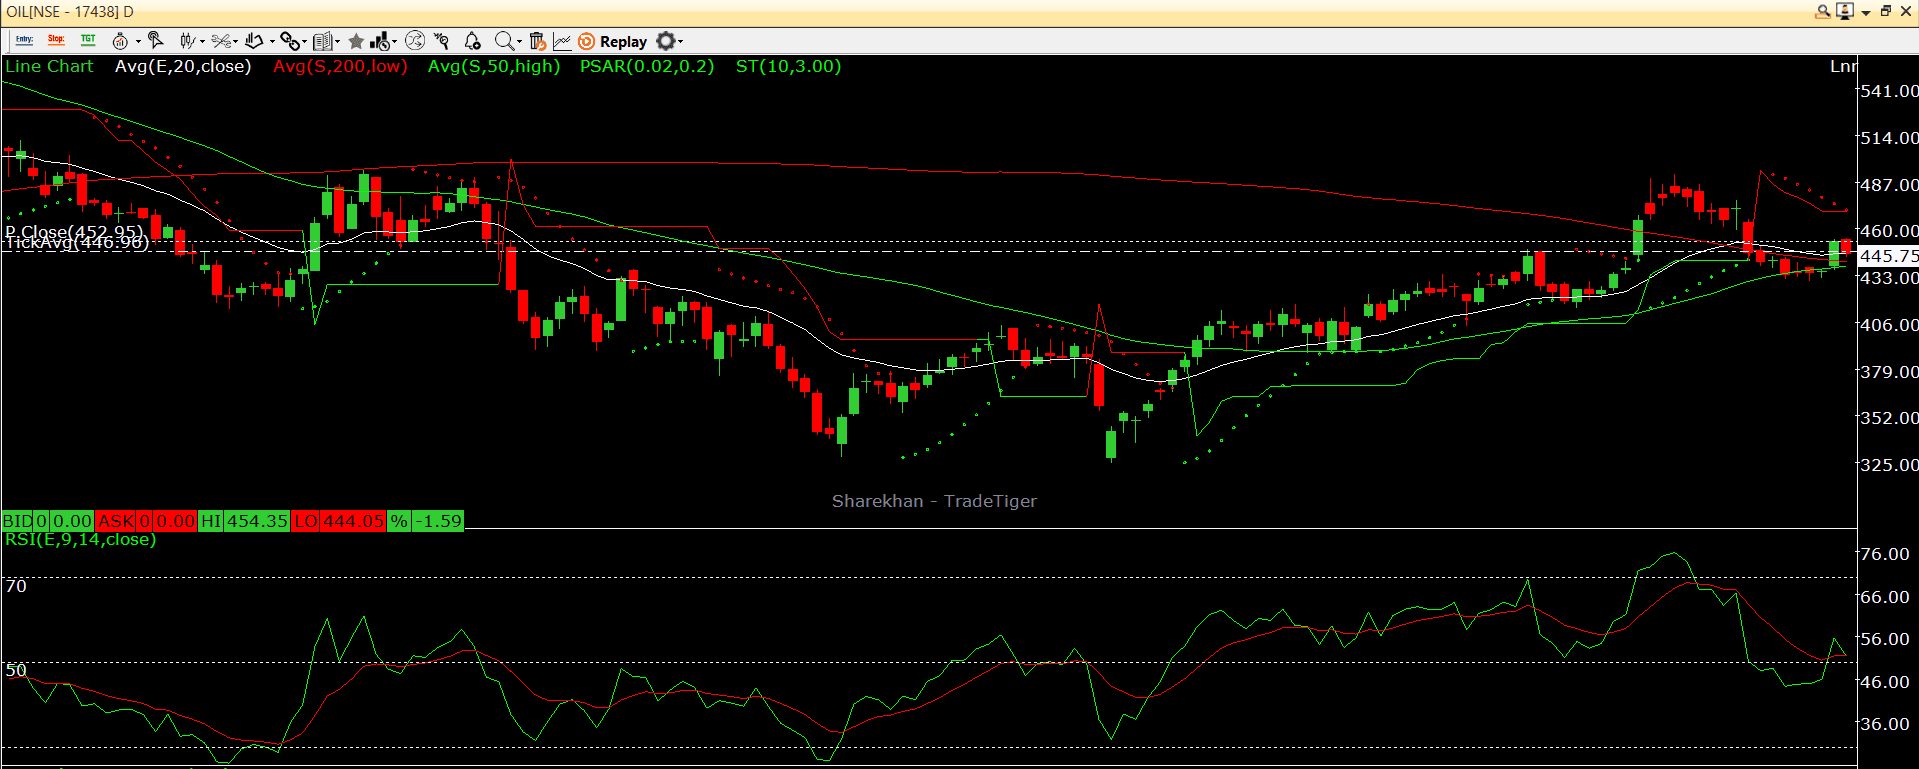
- Supertrend indicator is in a bullish mode, suggesting positive momentum.
- RSI has taken a bounce from lower levels, indicating a revival in buying interest.
- Price is trading above the 200 SMA, confirming a strong long-term bullish structure.
- The overall price action supports accumulation on dips with favorable risk-reward.
Trade Setup:
Buy Zone: ₹447 – ₹443
Target 1: ₹470
Target 2: ₹500
Stop Loss: ₹413 (closing basis)
Remarks:
- This setup aligns with trend-following strategies.
- Suitable for swing traders with moderate risk appetite.
- Watch for volume confirmation near entry levels for better conviction.
Peers:
Oil India's primary peers in the Indian oil and gas sector include Reliance Industries,