THERMAX
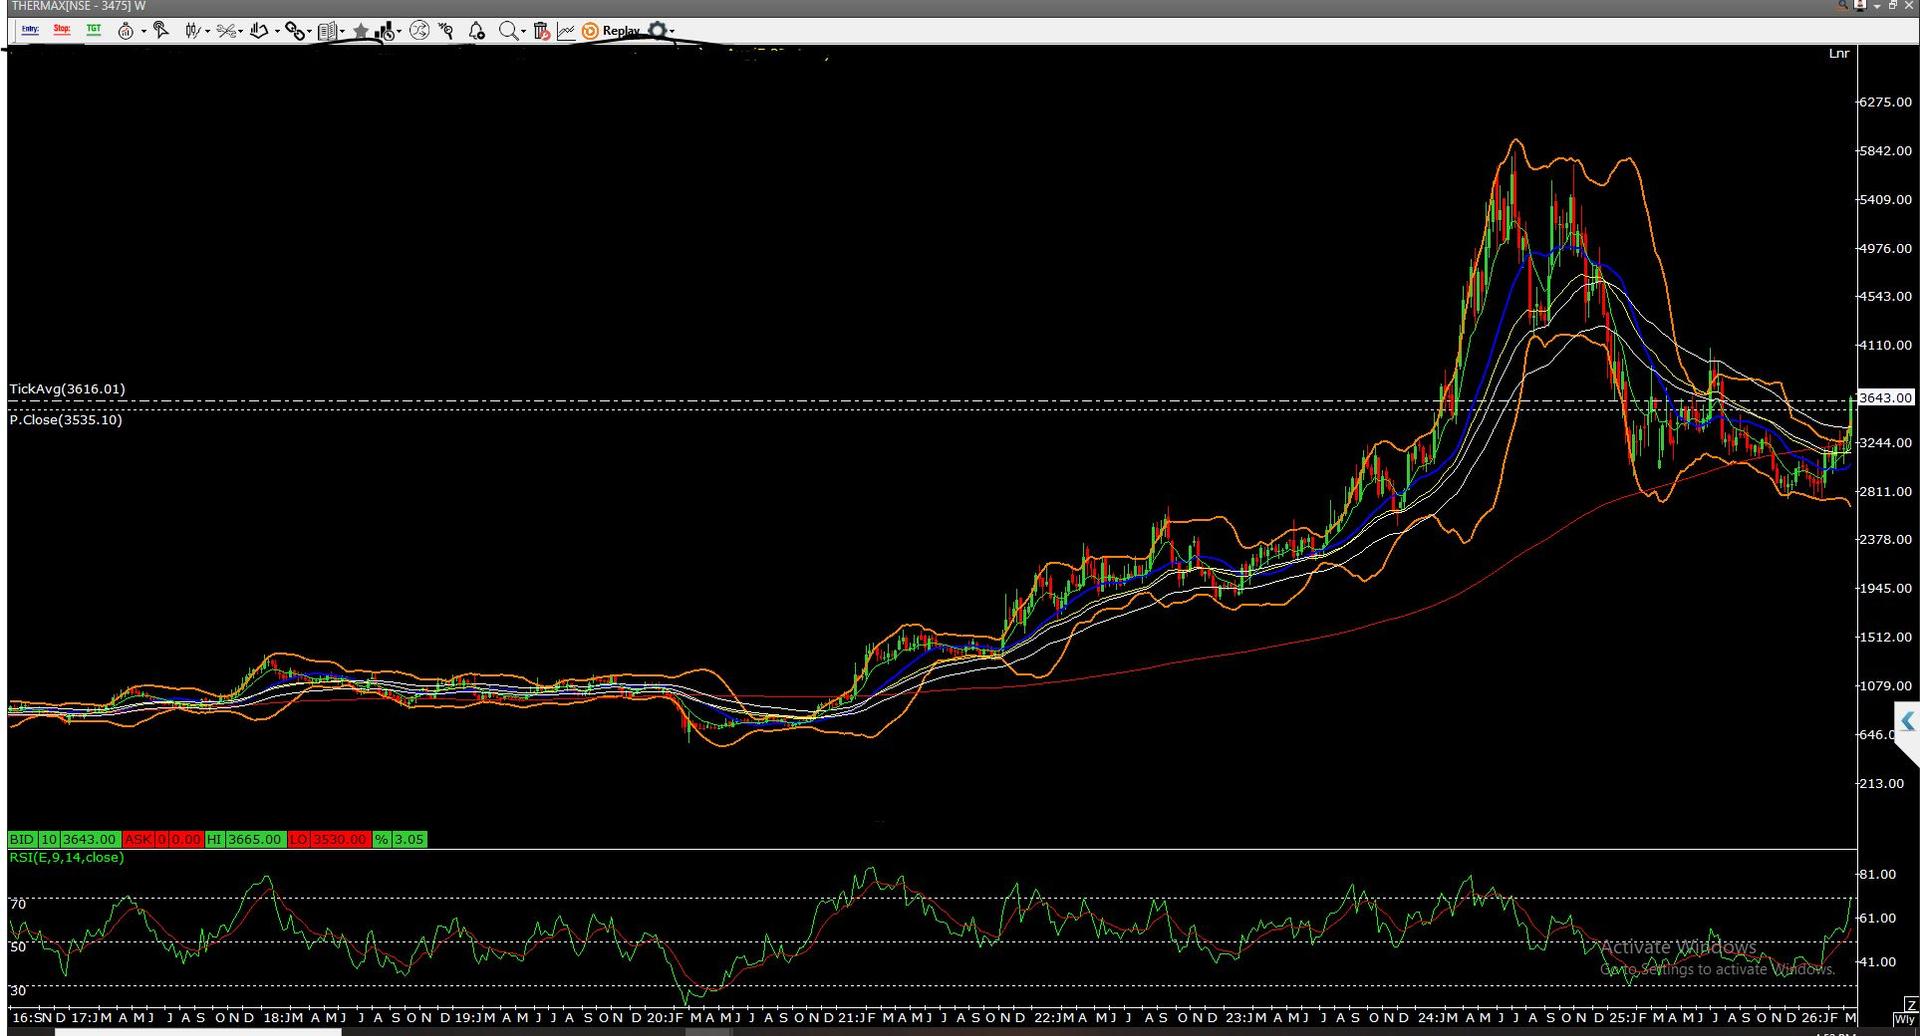
Thermax’s weekly chart reflects a classic market cycle—accumulation → breakout → expansion → correction → consolidation. Initially, the stock moved in a tight range for a long time, indicating accumulation. This base later fueled a strong breakout, where price moved above key moving averages with expanding Bollinger Bands, signaling rising momentum and participation. The uptrend then turned aggressive, with price moving sharply above the upper band. Such extended moves often lead to exhaustion, and the stock entered a corrective phase. The decline respected key dynamic supports like the 50 EMA and mid-Bollinger band, suggesting it was a pullback within a broader trend, not a breakdown. Currently, price is stabilizing around the 3000–3200 zone, forming a base. The long-term trend remains positive as the 200 EMA is still rising below price. RSI on the weekly chart is recovering toward the 60 level, indicating improving strength without being overbought. Learning takeaway: Strong trends are built on solid bases. Sharp rallies often cool off before the next move. Consolidation after correction can act as a launchpad if momentum returns. Educational scenario: Sustaining above the base may open a path toward higher zones like 3600–4100, while failure to hold could lead to retests of lower supports. Disclaimer: This is for educational purposes only, based on technical structure. Not a buy/sell recommendation.