TITAN Q4 Results & Technical Outlook
Titan Company reported a strong Q4 performance with net profit rising 35% YoY to Rs 1,179 crore, supported by healthy growth in jewellery sales, festive demand, and continued expansion across business segments. The company also announced a dividend, which further boosted investor sentiment. Following the results, the stock surged nearly 6%, showing strong market confidence.
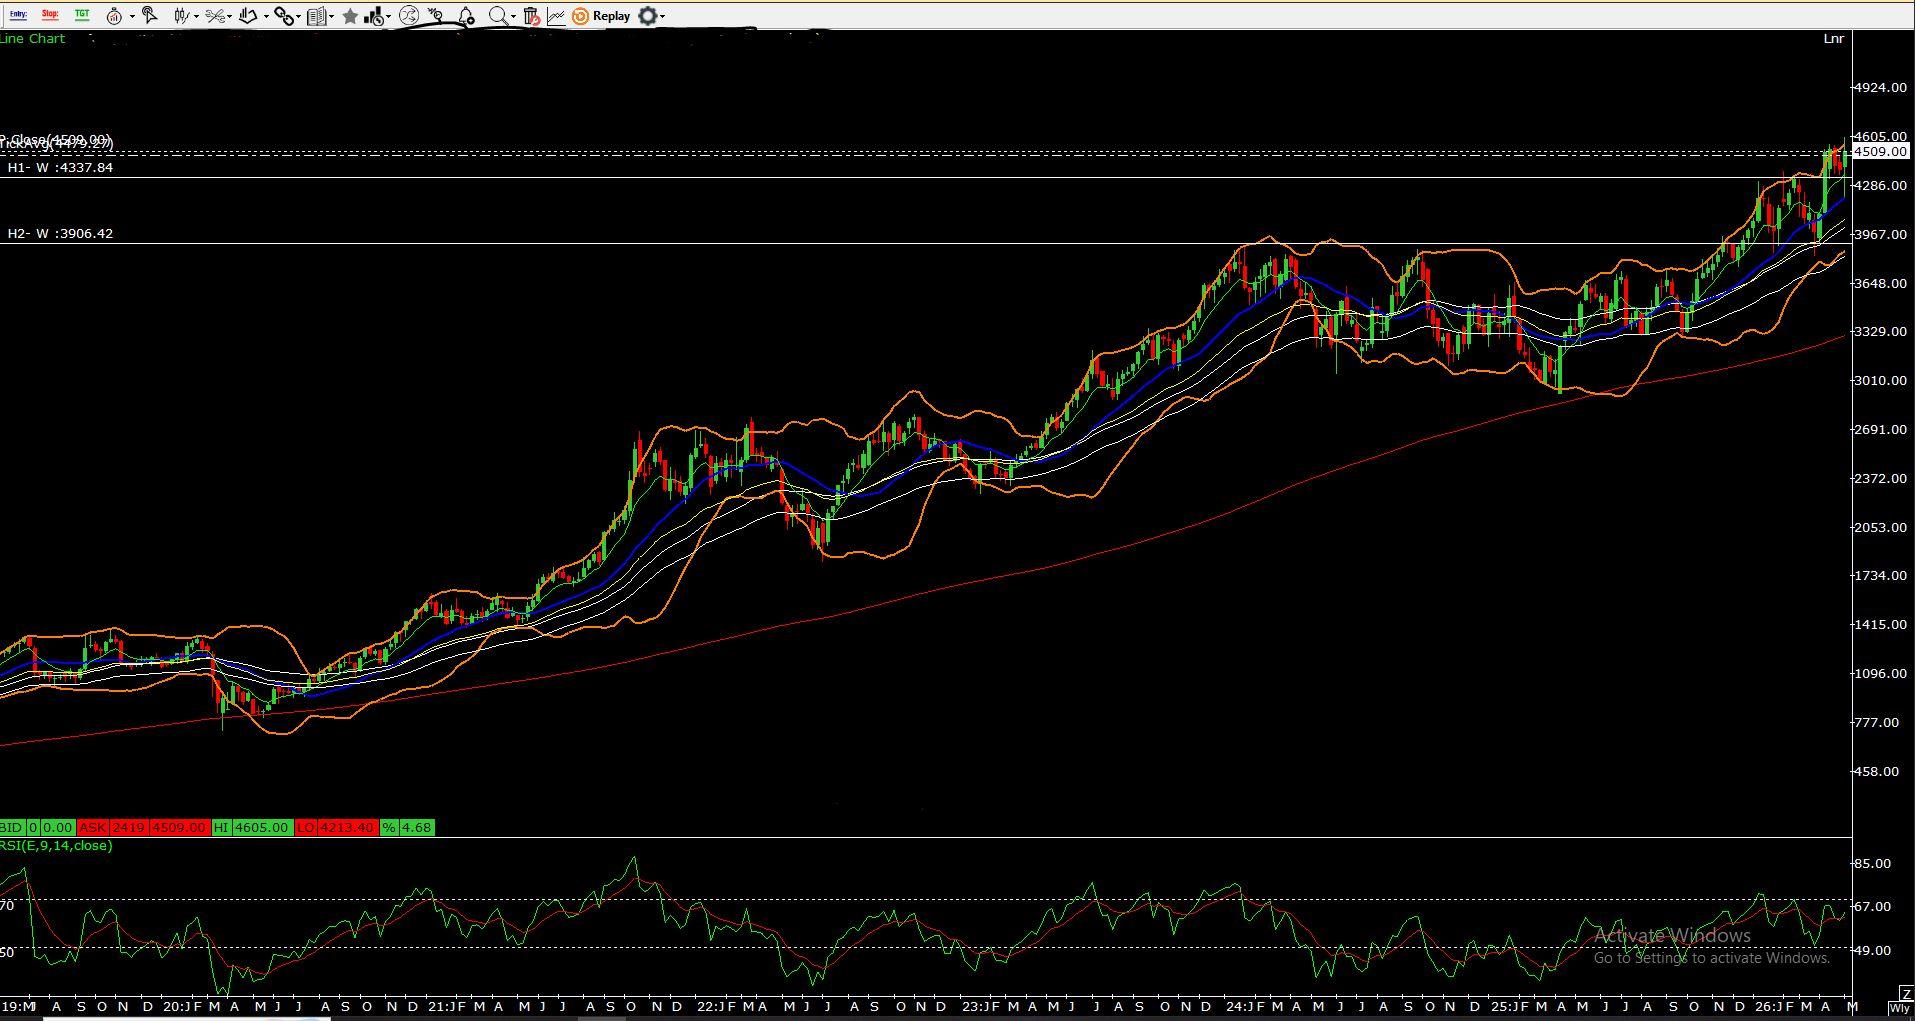
On the technical chart, Titan is trading around Rs 4,509 after a sharp breakout and is currently near its all-time high zone. The stock has moved above all key moving averages, indicating a strong long-term bullish trend. Price is also trading near the upper Bollinger Band, which reflects strong momentum but also suggests short-term overheating after a sharp rally.
The immediate resistance is placed near Rs 4,605, which is the recent high. A sustained move above this level can open the doors for further upside towards Rs 4,750–4,900 in the coming weeks.
On the downside, immediate support is seen near Rs 4,330–4,280, which is the breakout zone and also aligns with short-term moving averages. Stronger support is placed around Rs 3,967, where previous consolidation and medium-term support exists.
The RSI is hovering near 67, close to overbought territory but still below the extreme zone, suggesting bullish momentum remains intact though some profit booking or sideways consolidation cannot be ruled out after the recent rally.
Outlook: Titan remains technically strong with positive fundamentals after robust Q4 numbers. As long as the stock holds above Rs 4,280, the broader trend stays bullish. Short-term traders may watch Rs 4,605 for the next breakout confirmation, while long-term investors can remain positive on dips.