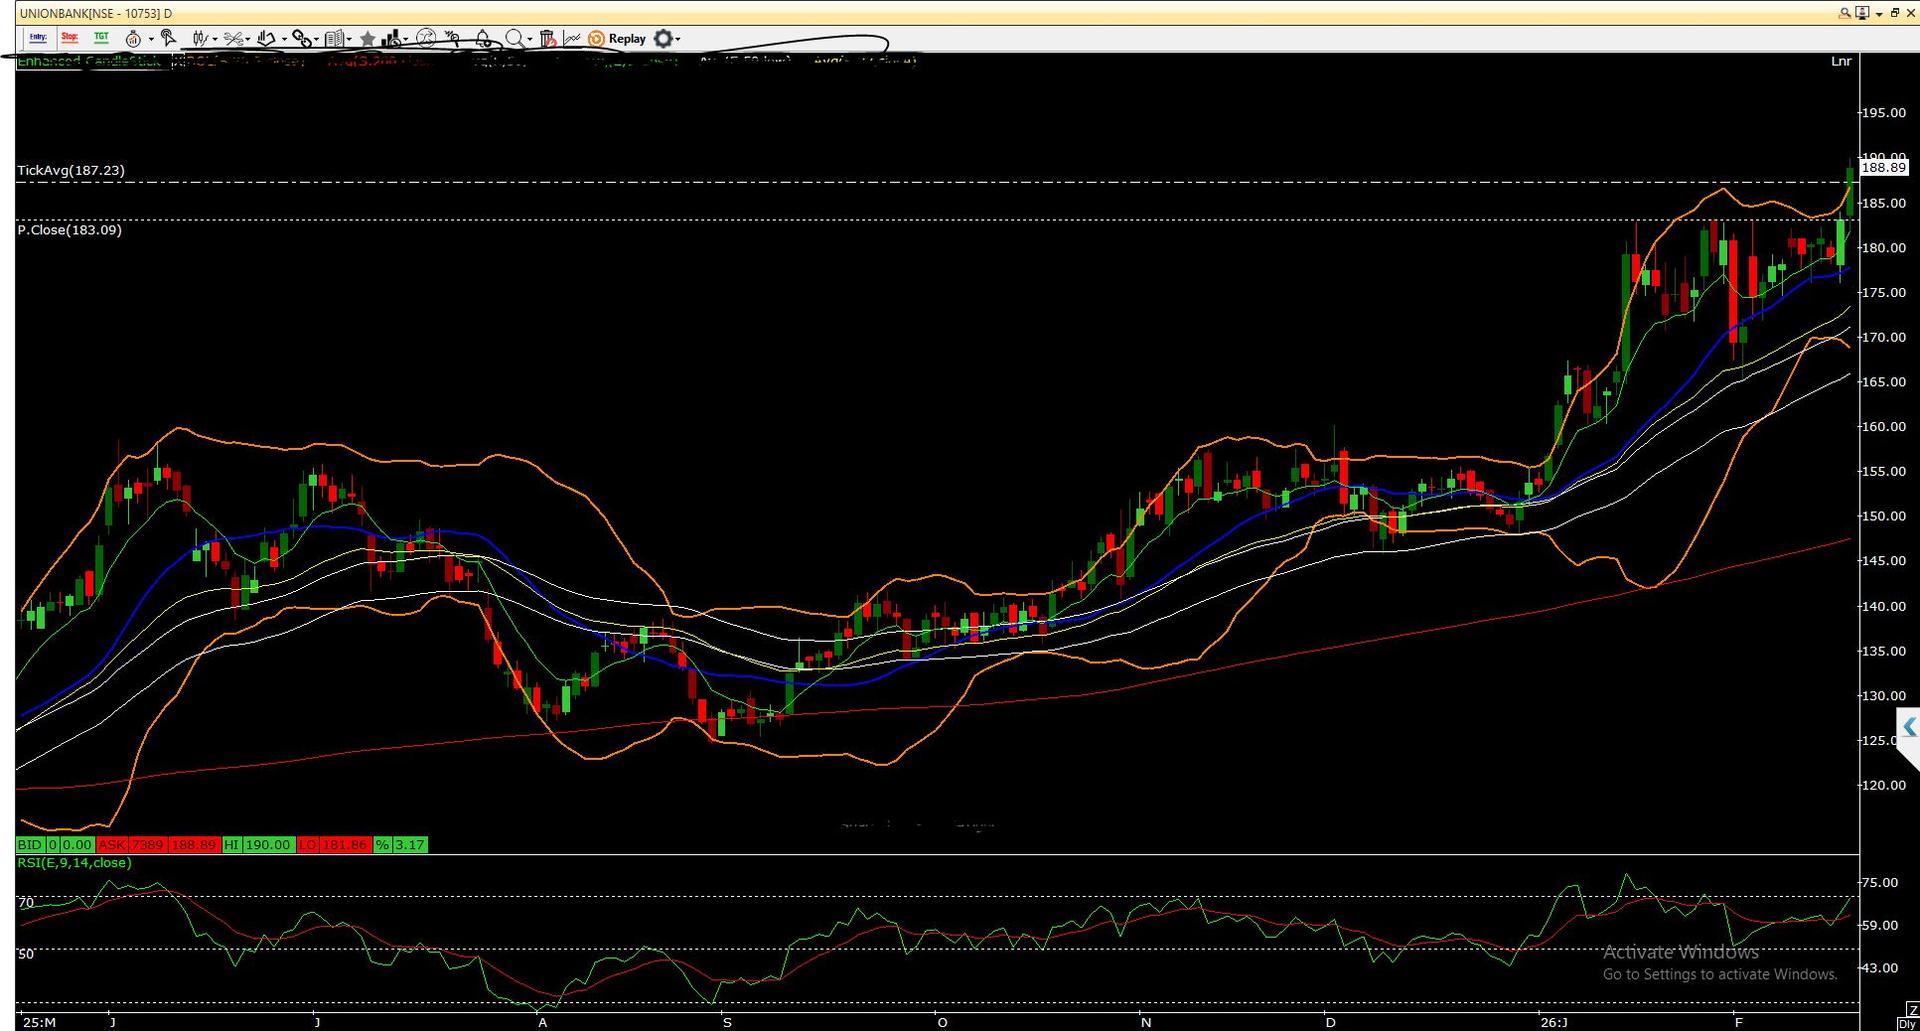
Union Bank of India – Detailed Technical Report
1. Price Structure & Trend Analysis
Union Bank is currently trading around 188–190 and has delivered a decisive breakout above the 180–185 resistance zone. The breakout is supported by a strong bullish candle, indicating expansion in momentum.
The stock continues to form a pattern of higher highs and higher lows, confirming an established uptrend. Price is trading comfortably above the short-term EMA cluster (8/21/33/50), reflecting strong short- to medium-term momentum. The 200 SMA is placed near 145–150 and is steadily rising, reinforcing long-term bullish structure.
2. Bollinger Band Behavior
Price is moving near the upper Bollinger Band, suggesting strength and volatility expansion. While this indicates bullish momentum, it may also result in brief consolidation before the next upward move.
3. Momentum Indicators
RSI (14) is positioned near 65–70, indicating strong momentum but nearing overbought territory. There is no visible bearish divergence, which supports continuation bias.
4. Key Technical Levels
Immediate Resistance: 195
Next Resistance: 205–210
Immediate Support: 180
Strong Support: 170–172
Positional Support: 150
Trade Setup