


HINDZINC stock price analysis and breakout
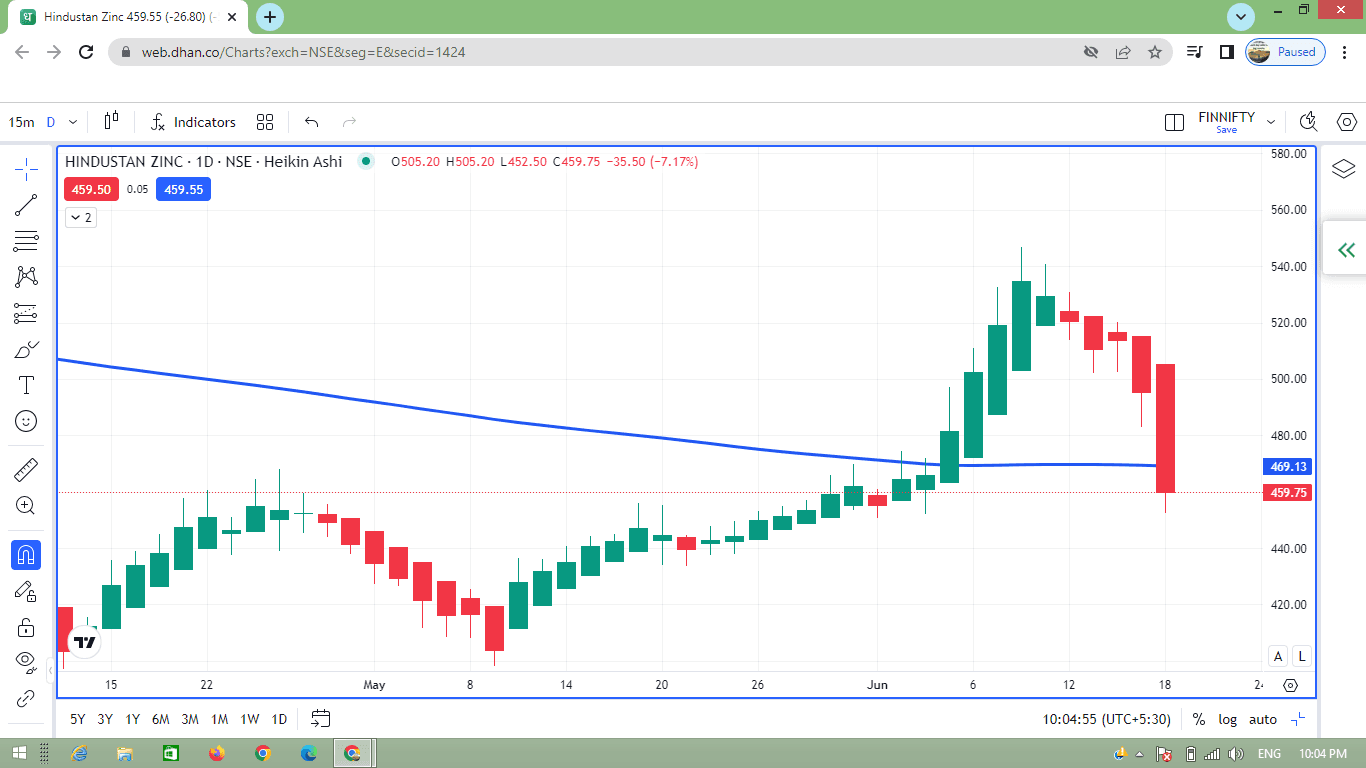
after a uptrend the stock price of HINDZINC started consolidating between the range of 502 and 545
and formed a rounding top chart pattern on daily basis chart
on 5th june the stock price closed above 200 moving averageafter which a sharp uptrend was seen
it started consolidating from 11th june
and yesterday the stock price closed below the important support level of 502
the 200 moving average will act as an important support level
if the gives its closing below 200 moving average we will be further bearish in it
#TechnicalViews#WatchOutFor
194 likes·55 comments