Nifty 50 at Critical Support: Bounce or Breakdown?
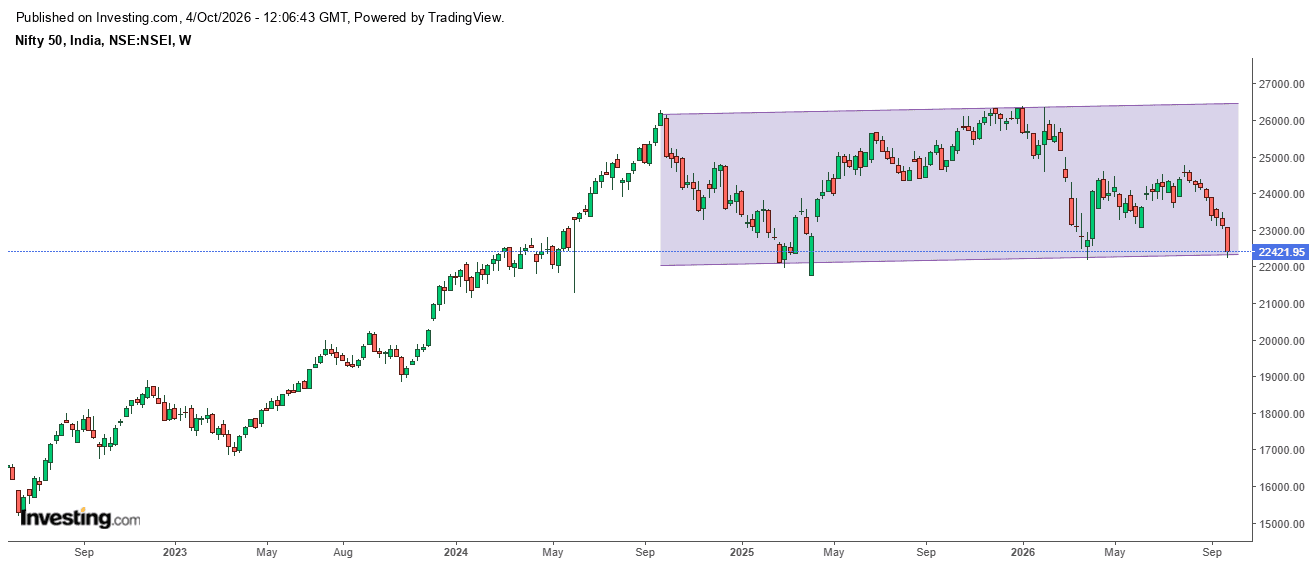
!nifty Nifty 50 at Critical Support: Bounce, Stabilisation or Breakdown? After an extended period of weakness, Nifty 50 is approaching major support zones on the weekly chart. Nifty 50: Testing a Major Support Zone The weekly Nifty chart shows a substantial correction from the 26,000-plus region. The index is now approaching the lower portion of the broader trading range visible on the chart. The area I am monitoring is approximately: 22,000–22,400, Within this, 22,200–22,300 is particularly important. If this support holds, the first question is whether Nifty can reclaim 22,800–23,000. A sustained recovery above that zone could shift attention toward approximately 23,200–23,800. A stronger trend-repair signal would require Nifty to move substantially higher, toward the 23,800–24,000 region. On the other hand, a decisive breakdown below 22,000–22,200 would weaken the current structure and increase the probability of further downside. The important question is not: “Has the market bottomed❔” It is: “Will support hold and will price action confirm a reversal ❔ ” I am watching: Nifty 22,200–22,300 Nifty recovery 22,800–23,000 then 23,200–23,800 Support → Stabilisation → Confirmation I have shared my complete weekly-chart analysis of both indices in the article.