


Ascending Triangle is generally a bullish chart pattern
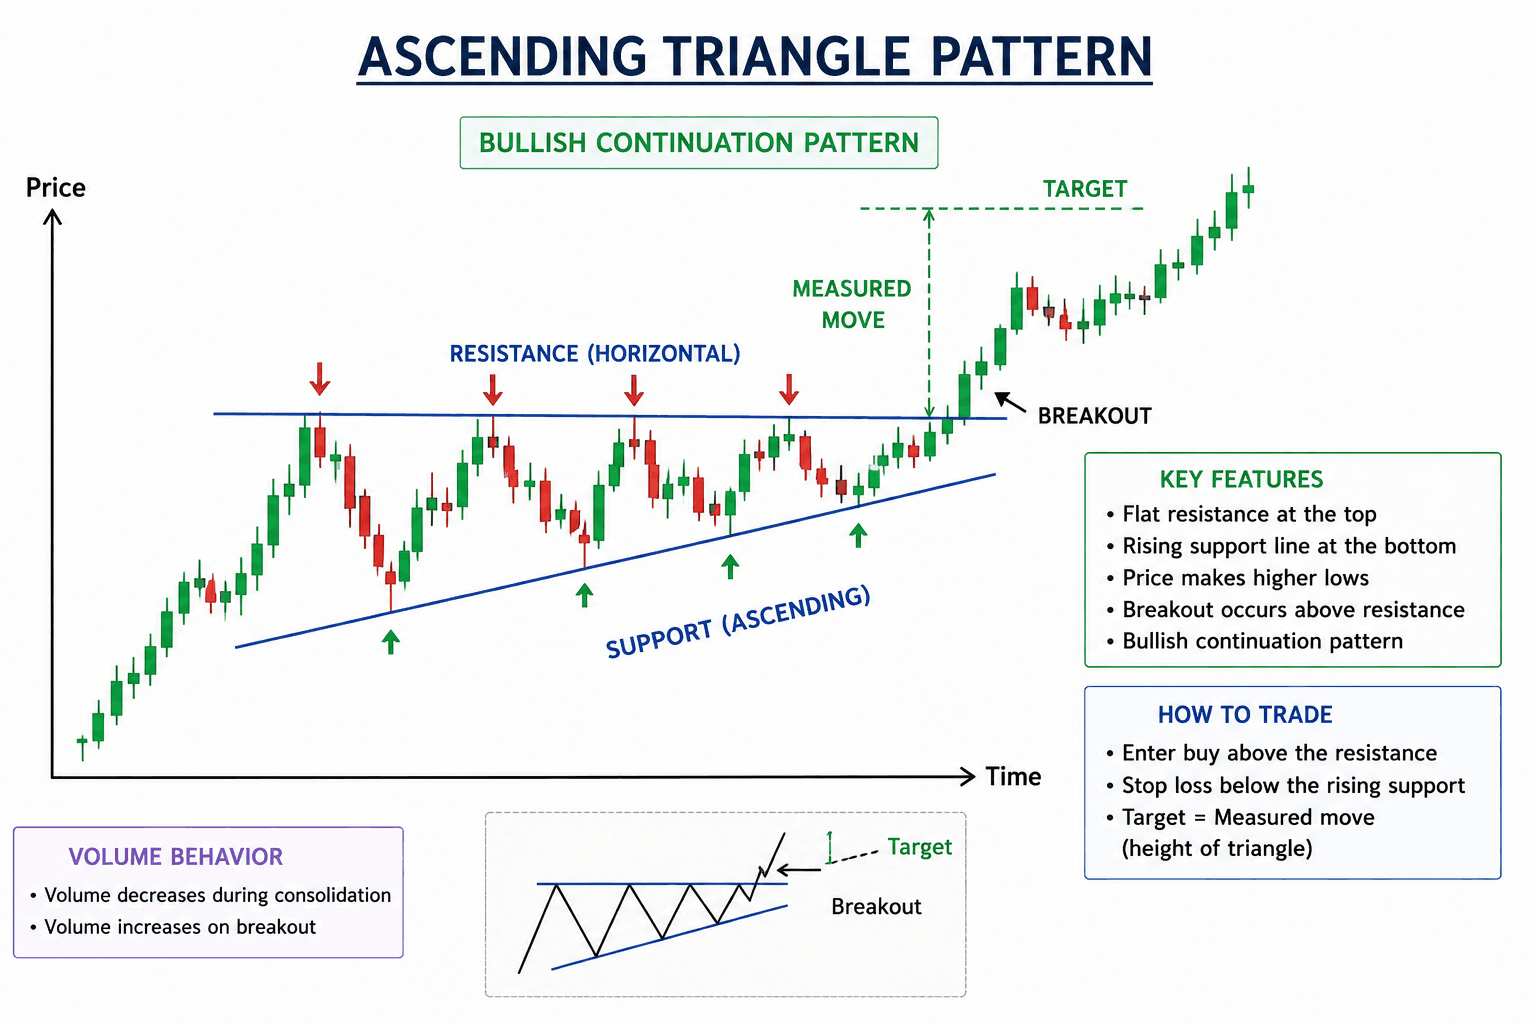
TBZ An Ascending Triangle is generally a bullish chart pattern formed when price repeatedly faces a horizontal resistance level at the top while making higher lows underneath, creating an upward-sloping support line; this shows that buyers are becoming increasingly aggressive because each dip is being bought at a higher price, while sellers continue defending the same resistance. The pattern is considered confirmed when price breaks and closes above the horizontal resistance with strong volume, after which the previous resistance can act as support and the potential target is often estimated by adding the height of the triangle to the breakout point. image is attached for your reference, kindly check it
#TechnicalViews
766 likes·50 comments