


A trendline acts as resistance when it is drawn
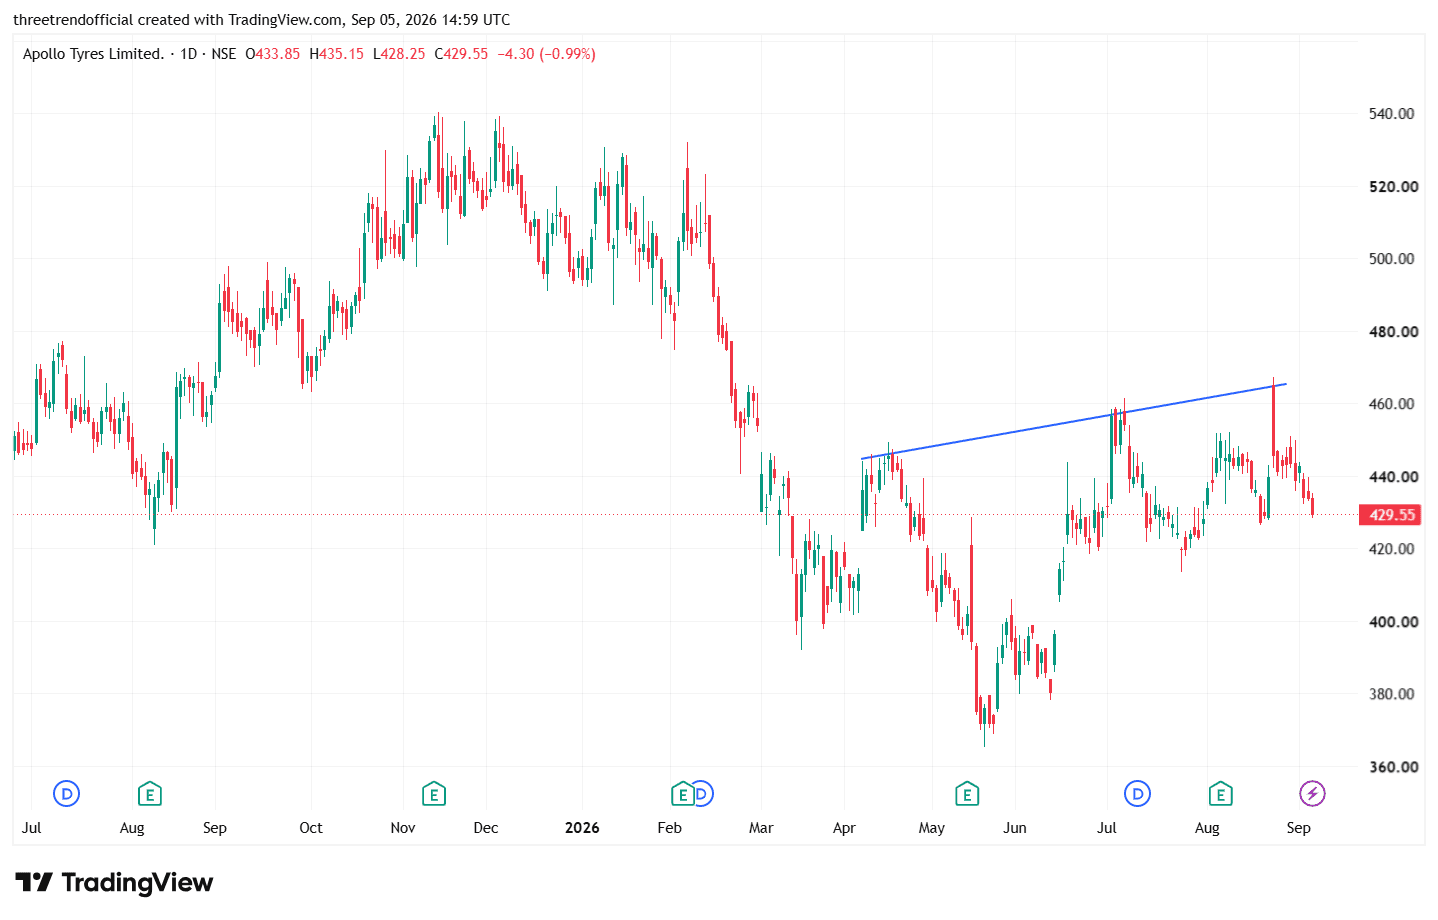
APOLLOTYRE A trendline acts as resistance when it is drawn by connecting a series of lower swing highs during a downtrend. Each time price approaches this descending trendline, sellers may become active and push the price lower. Repeated rejection from the same trendline makes it more significant as a dynamic resistance zone. A strong breakout above the trendline, preferably supported by higher volume and sustained price action, can indicate that selling pressure is weakening and a potential trend reversal or bullish momentum may be developing.
In simple terms:
Lower highs → descending trendline → repeated rejection → resistance → breakout above trendline = possible bullish reversal. chart is attached
#TechnicalViews#FundamentalViews
738 likes·75 comments