


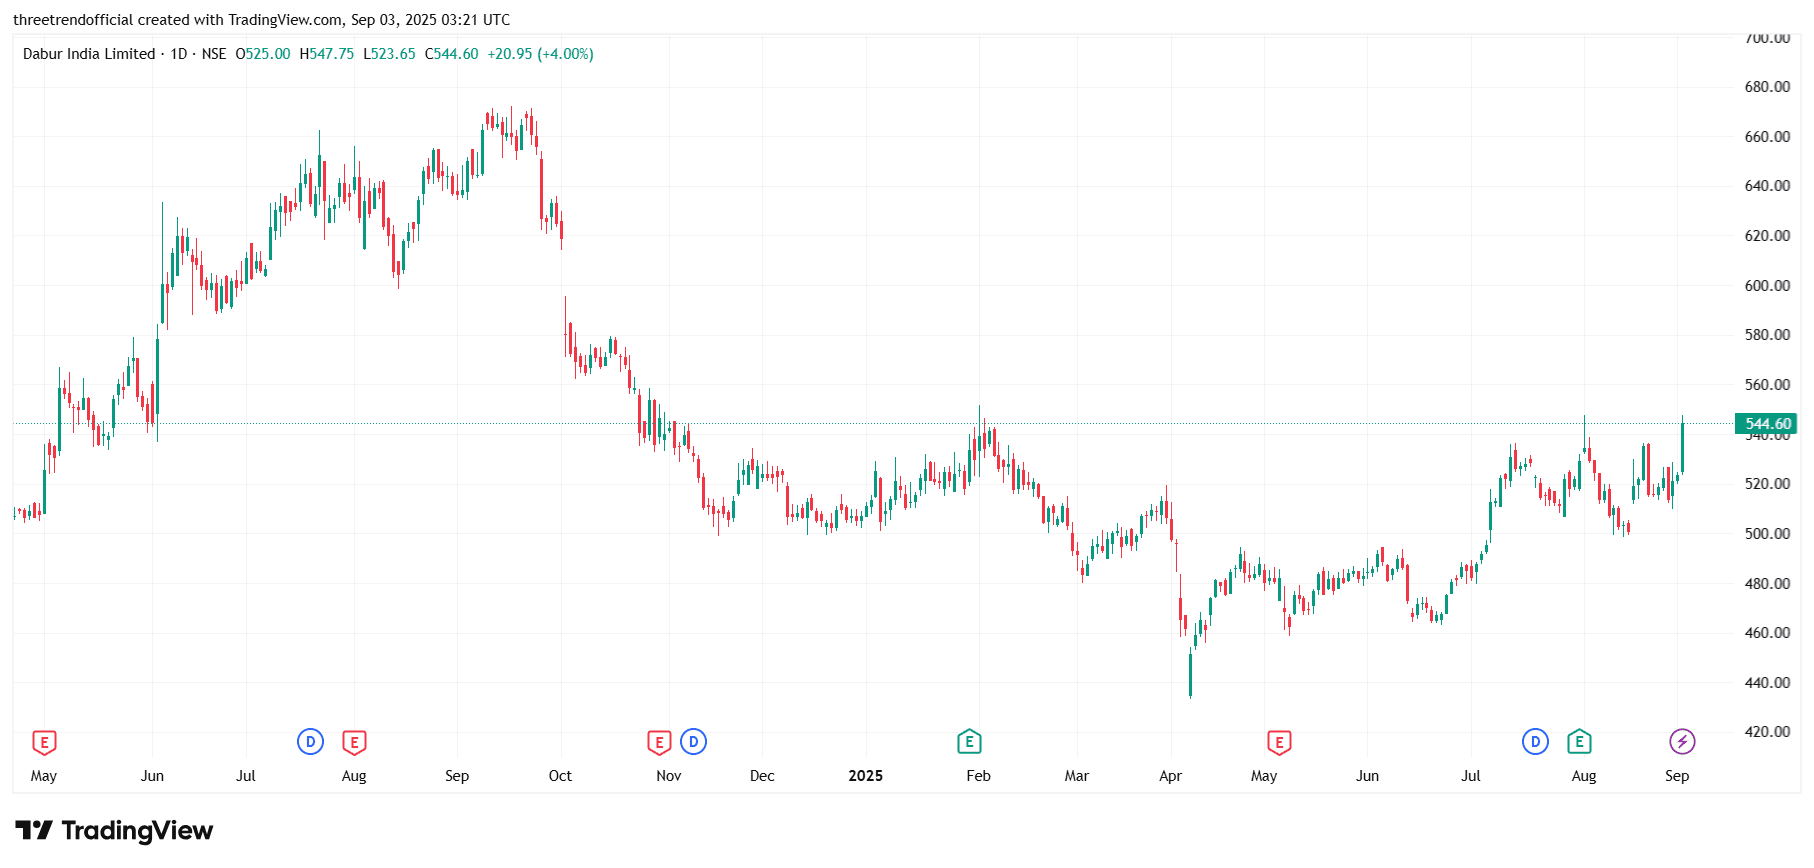
DABUR The chart of Dabur India Limited (NSE) shows that after a prolonged downtrend from the 650–670 zone to a low near 430, the stock has been consolidating in a broad range between 460–540 levels for the past few months. Recently, it has given a strong breakout above the 540 resistance zone with a 4% surge, supported by bullish momentum. This breakout suggests the possibility of further upside toward the 560–580 levels in the short term, while 520 now acts as an immediate support. Sustaining above 540 will be crucial for confirming trend reversal, otherwise weakness may re-emerge if it slips back into the range.
#FundamentalViews#TechnicalViews
728 likes·88 comments