


15th Jul · SEBI Registration INH000022729
SEBI Registration INH000022729 · 15th Jul
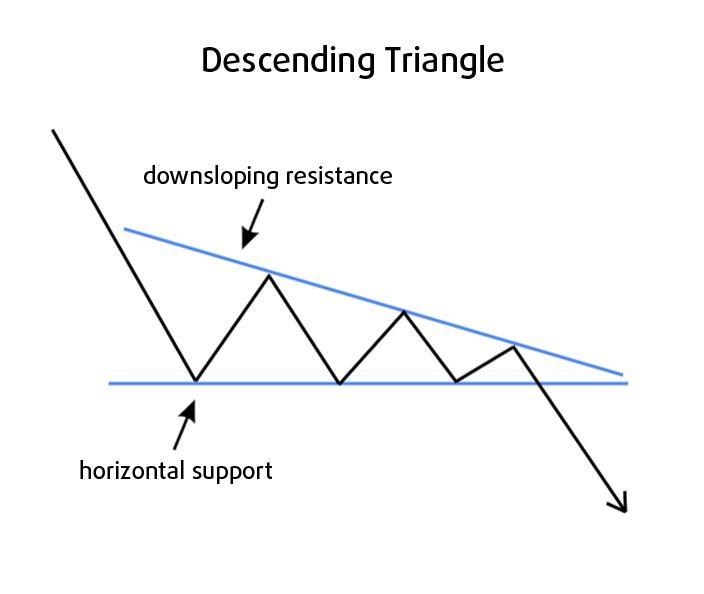
Descending Triangle
A descending triangle is a bearish chart pattern formed by a horizontal support line at the bottom and a descending trendline connecting lower highs. It indicates increasing selling pressure as sellers become more aggressive while buyers continue defending the same support level. As the price contracts within the pattern, a decisive breakdown below support with strong trading volume signals a potential continuation of the downtrend. Traders often wait for a breakdown confirmation and a retest of the broken support, which then acts as resistance, before entering short positions to reduce the risk of false breakdowns. JUSTDIAL
#FundamentalViews#TechnicalViews
781 likes·78 comments