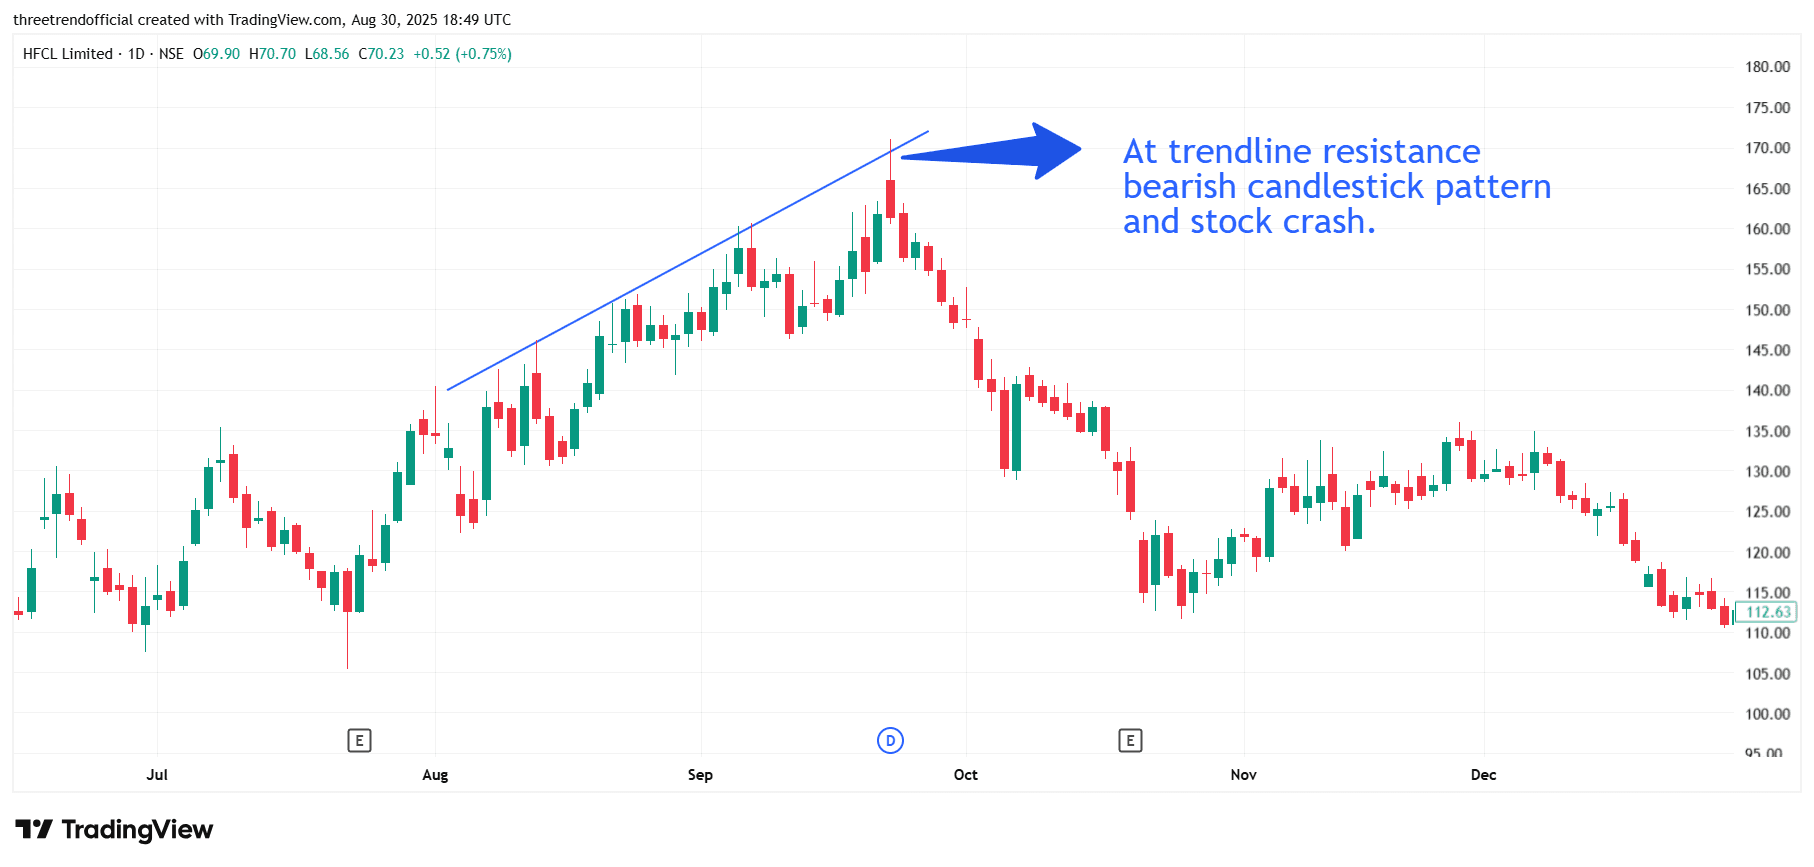
HFCL This chart of HFCL Ltd (NSE) clearly shows how the stock faced trendline resistance, where a strong bearish candlestick pattern (long upper wick rejection) was formed, indicating supply pressure and exhaustion of the uptrend. The failure to sustain above the resistance line triggered heavy selling, leading to a sharp decline and prolonged downtrend. Such setups highlight the importance of combining trendline resistance with candlestick confirmation, as they often signal a potential reversal and create profitable shorting or exit opportunities before a major stock crash.
#FundamentalViews#TechnicalViews