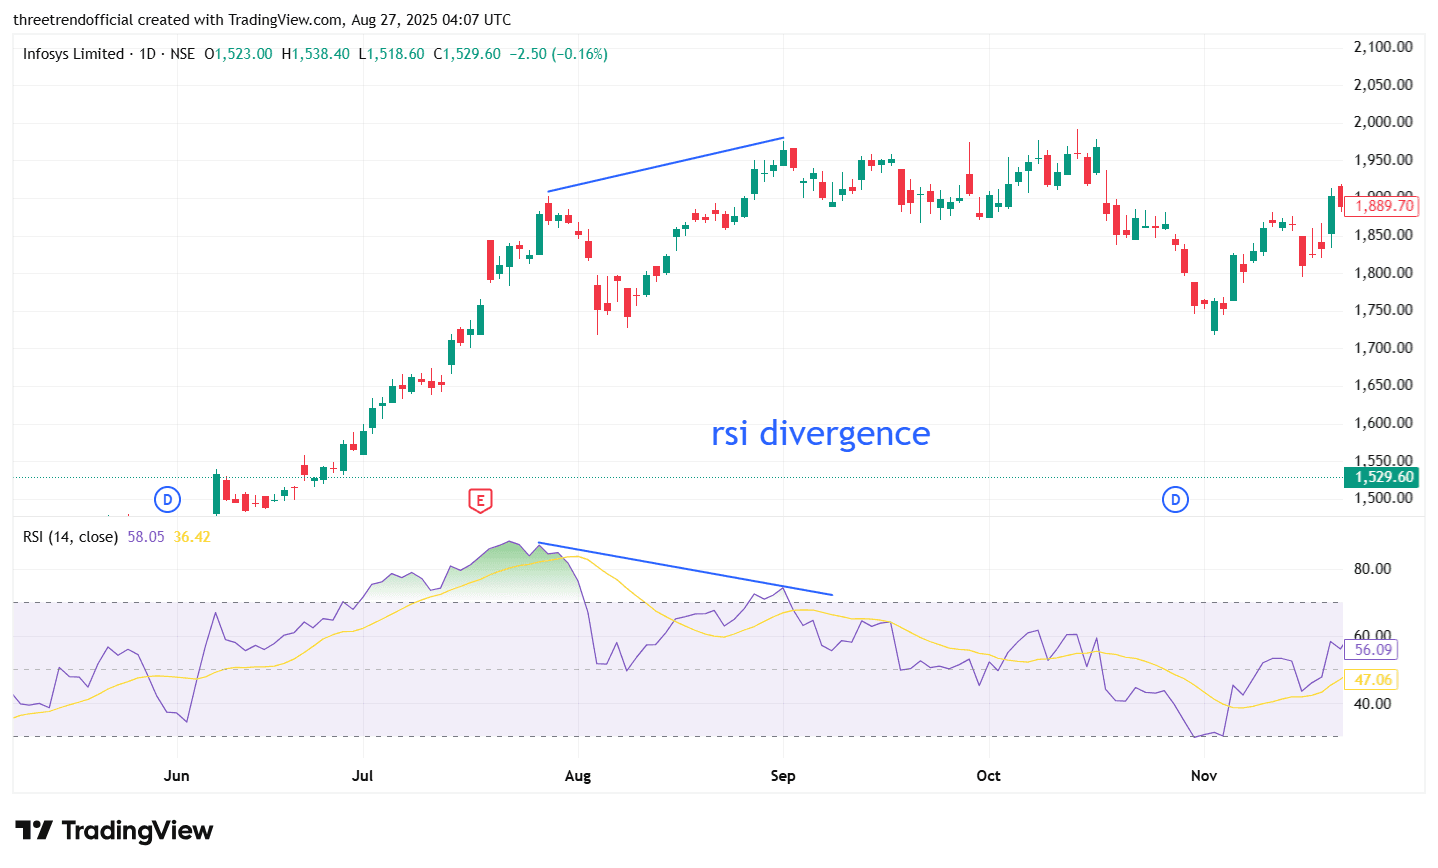
INFY In the chart, we can see a clear case of RSI bearish divergence. While the stock price makes a higher high, the RSI indicator forms a lower high, signaling that momentum is weakening despite the price moving up. This divergence often suggests that buyers are losing strength and a potential trend reversal or correction could follow. Traders typically look for confirmation through bearish candles, breakdown of support, or further weakness in RSI before acting on this signal.
#FundamentalViews#TechnicalViews