


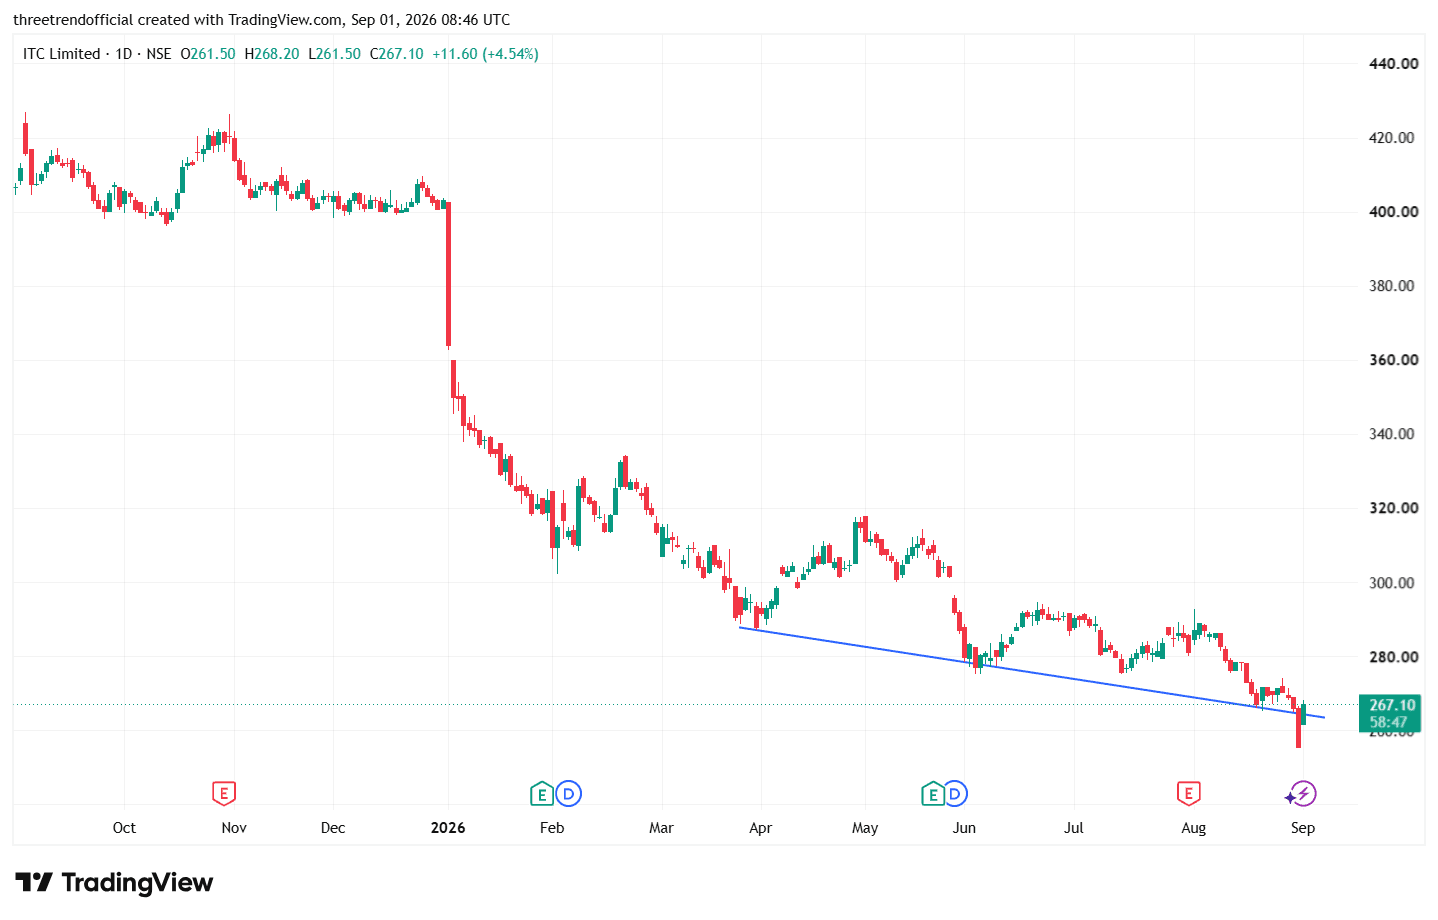
ITC CHART LEARNING PURPOSE ANLYSIS-CHART ATTACHED
ITC ITC has broken below the rising trendline support, indicating increasing selling pressure and weakness in the short-term structure. The price has moved below the trendline around ₹270–₹272, and the sharp intraday fall toward the ₹260 area shows strong volatility. However, the recovery back toward ₹267 suggests some buying interest at lower levels. If the stock sustains below the broken trendline, the breakdown can remain valid and further downside pressure may continue. A move back above ₹270–₹272 would be an early sign of a possible false breakdown. ₹260–₹262 is an important immediate support area to ***** is attached for your study purpose,you can improve your study with this chart.
#TechnicalViews
941 likes·52 comments