


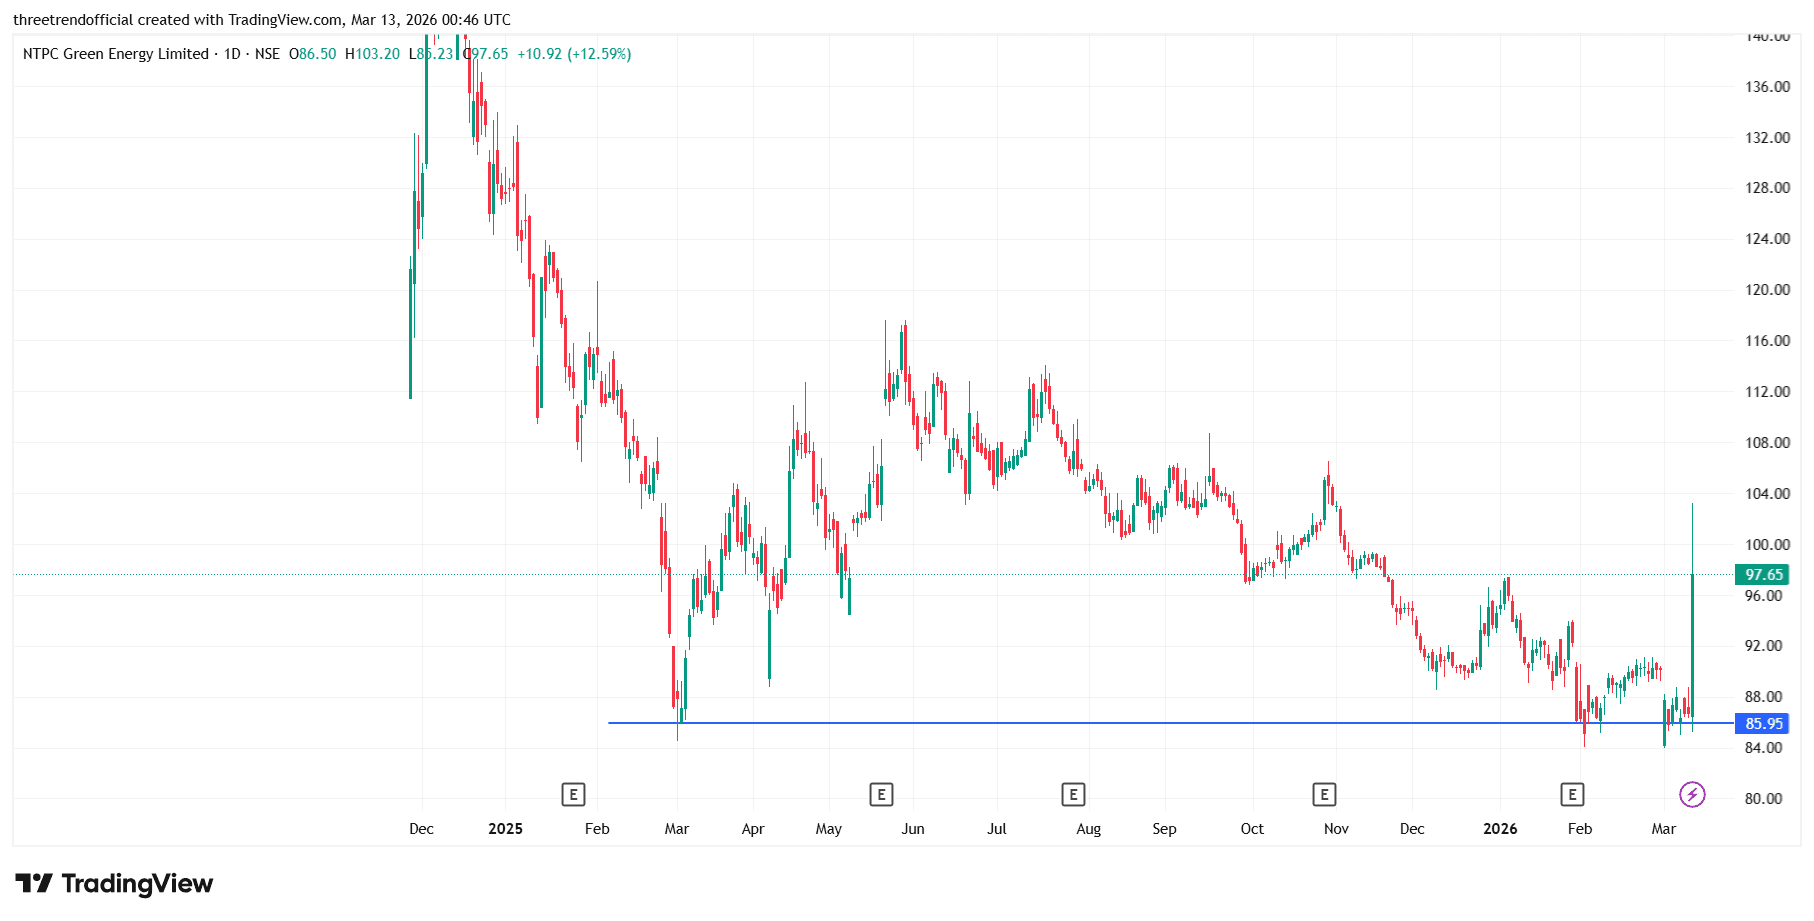
NTPCGREEN The horizontal trendline is a straight line drawn across a chart at a level where the price has repeatedly faced support or resistance. It connects multiple swing highs or swing lows at nearly the same price level, showing that the market is respecting that zone. When the price approaches this horizontal level, it often reacts because traders consider it an important decision area where demand or supply is concentrated. If the price breaks this horizontal trendline with strong momentum, it can indicate a potential breakout or breakdown, often leading to a new directional move in the stock.
#TechnicalViews#FundamentalViews
696 likes·48 comments