



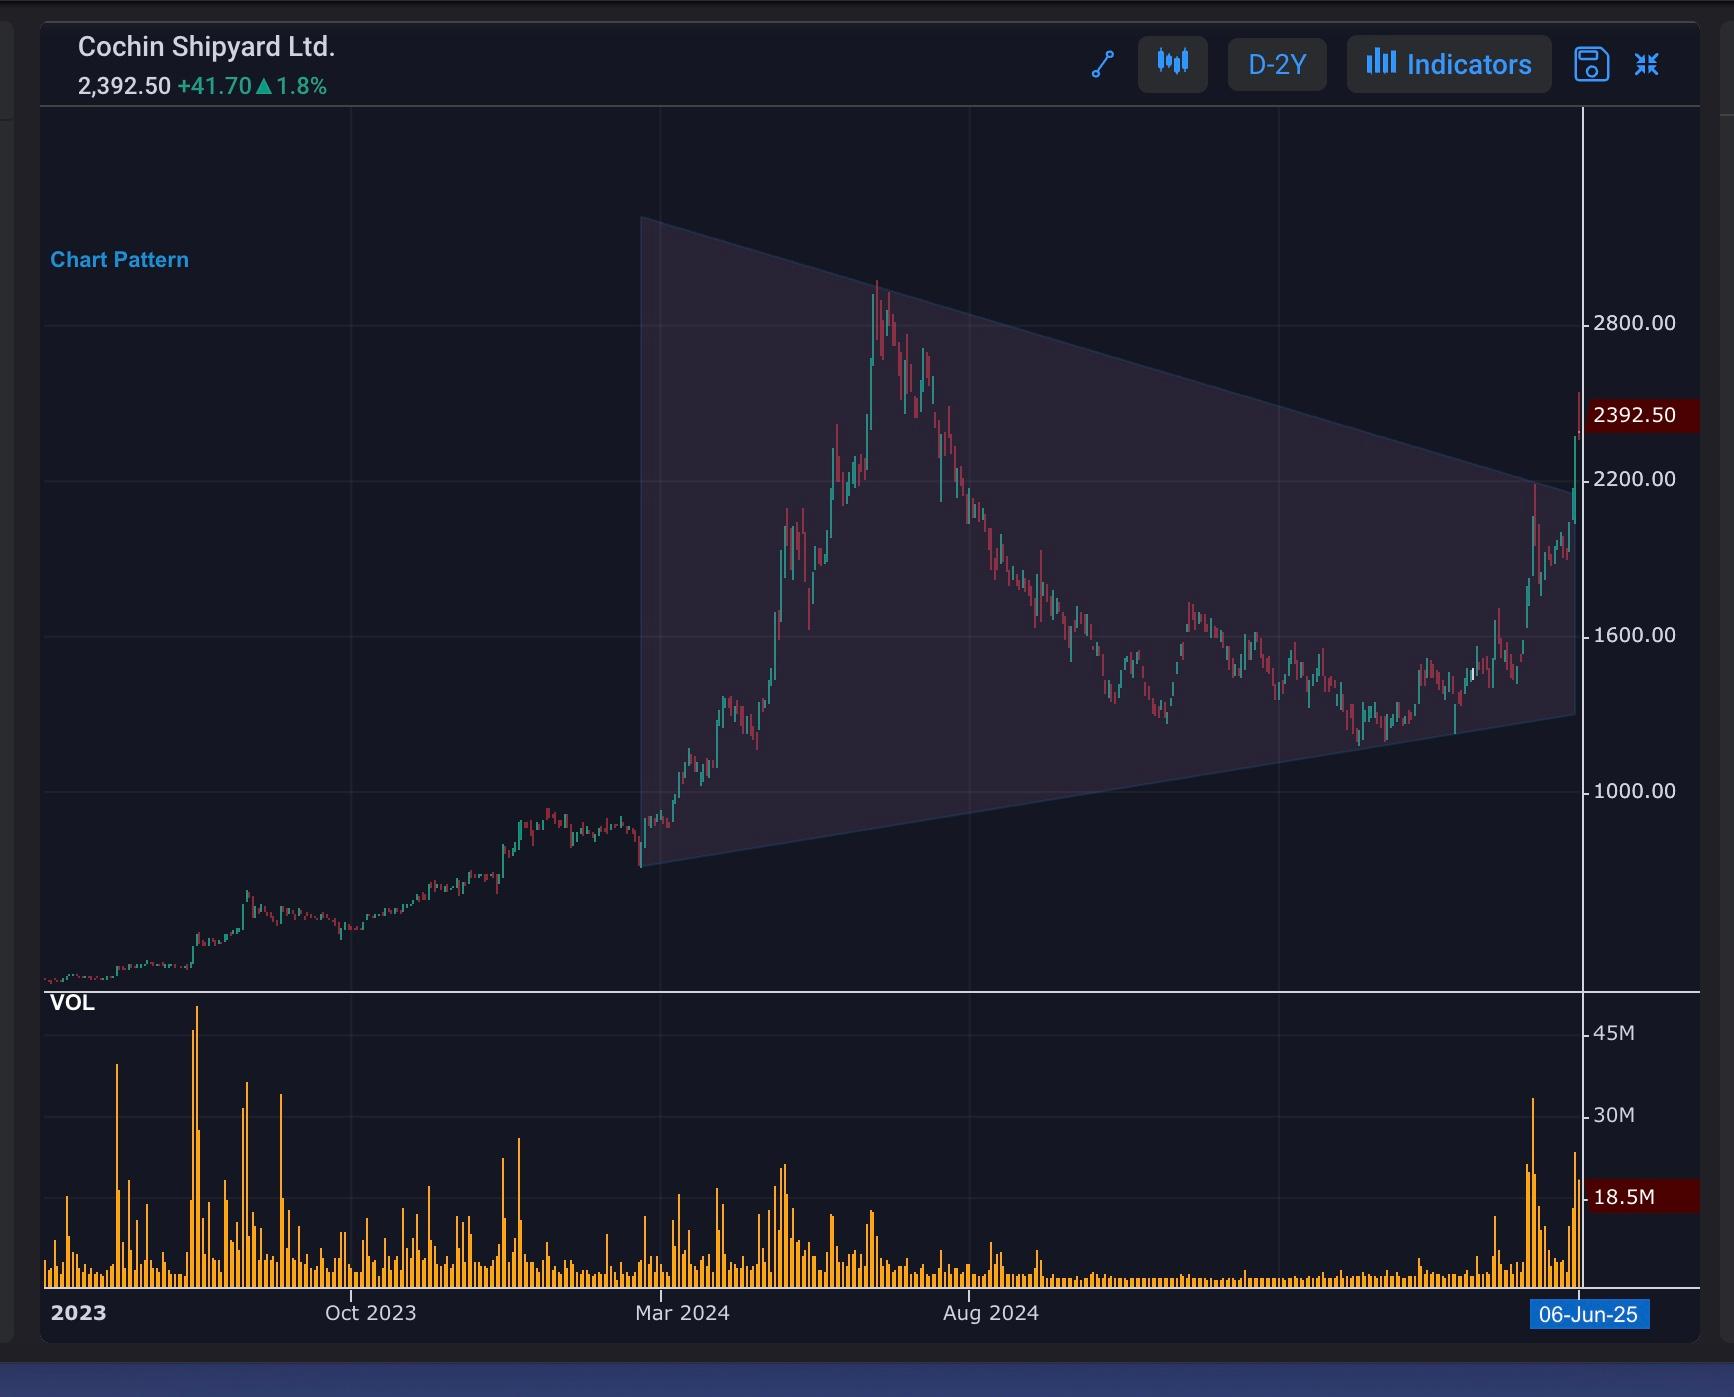
Breakout from Symmetric Triangle: A Trading Opportunity
COCHINSHIP
A Symmetric Triangle is a chart pattern that forms when a stock's price action creates a series of higher lows and lower highs, converging into a single point. A breakout from this pattern occurs when the stock's price surpasses the triangle's upper or lower trendline. This breakout can be a powerful trading signal, indicating a potential trend reversal or continuation. A breakout from a Symmetric Triangle can offer traders and investors a high-probability trading opportunity, with a clear direction and potential price target
#WatchOutFor#TechnicalViews
229 likes·91 comments