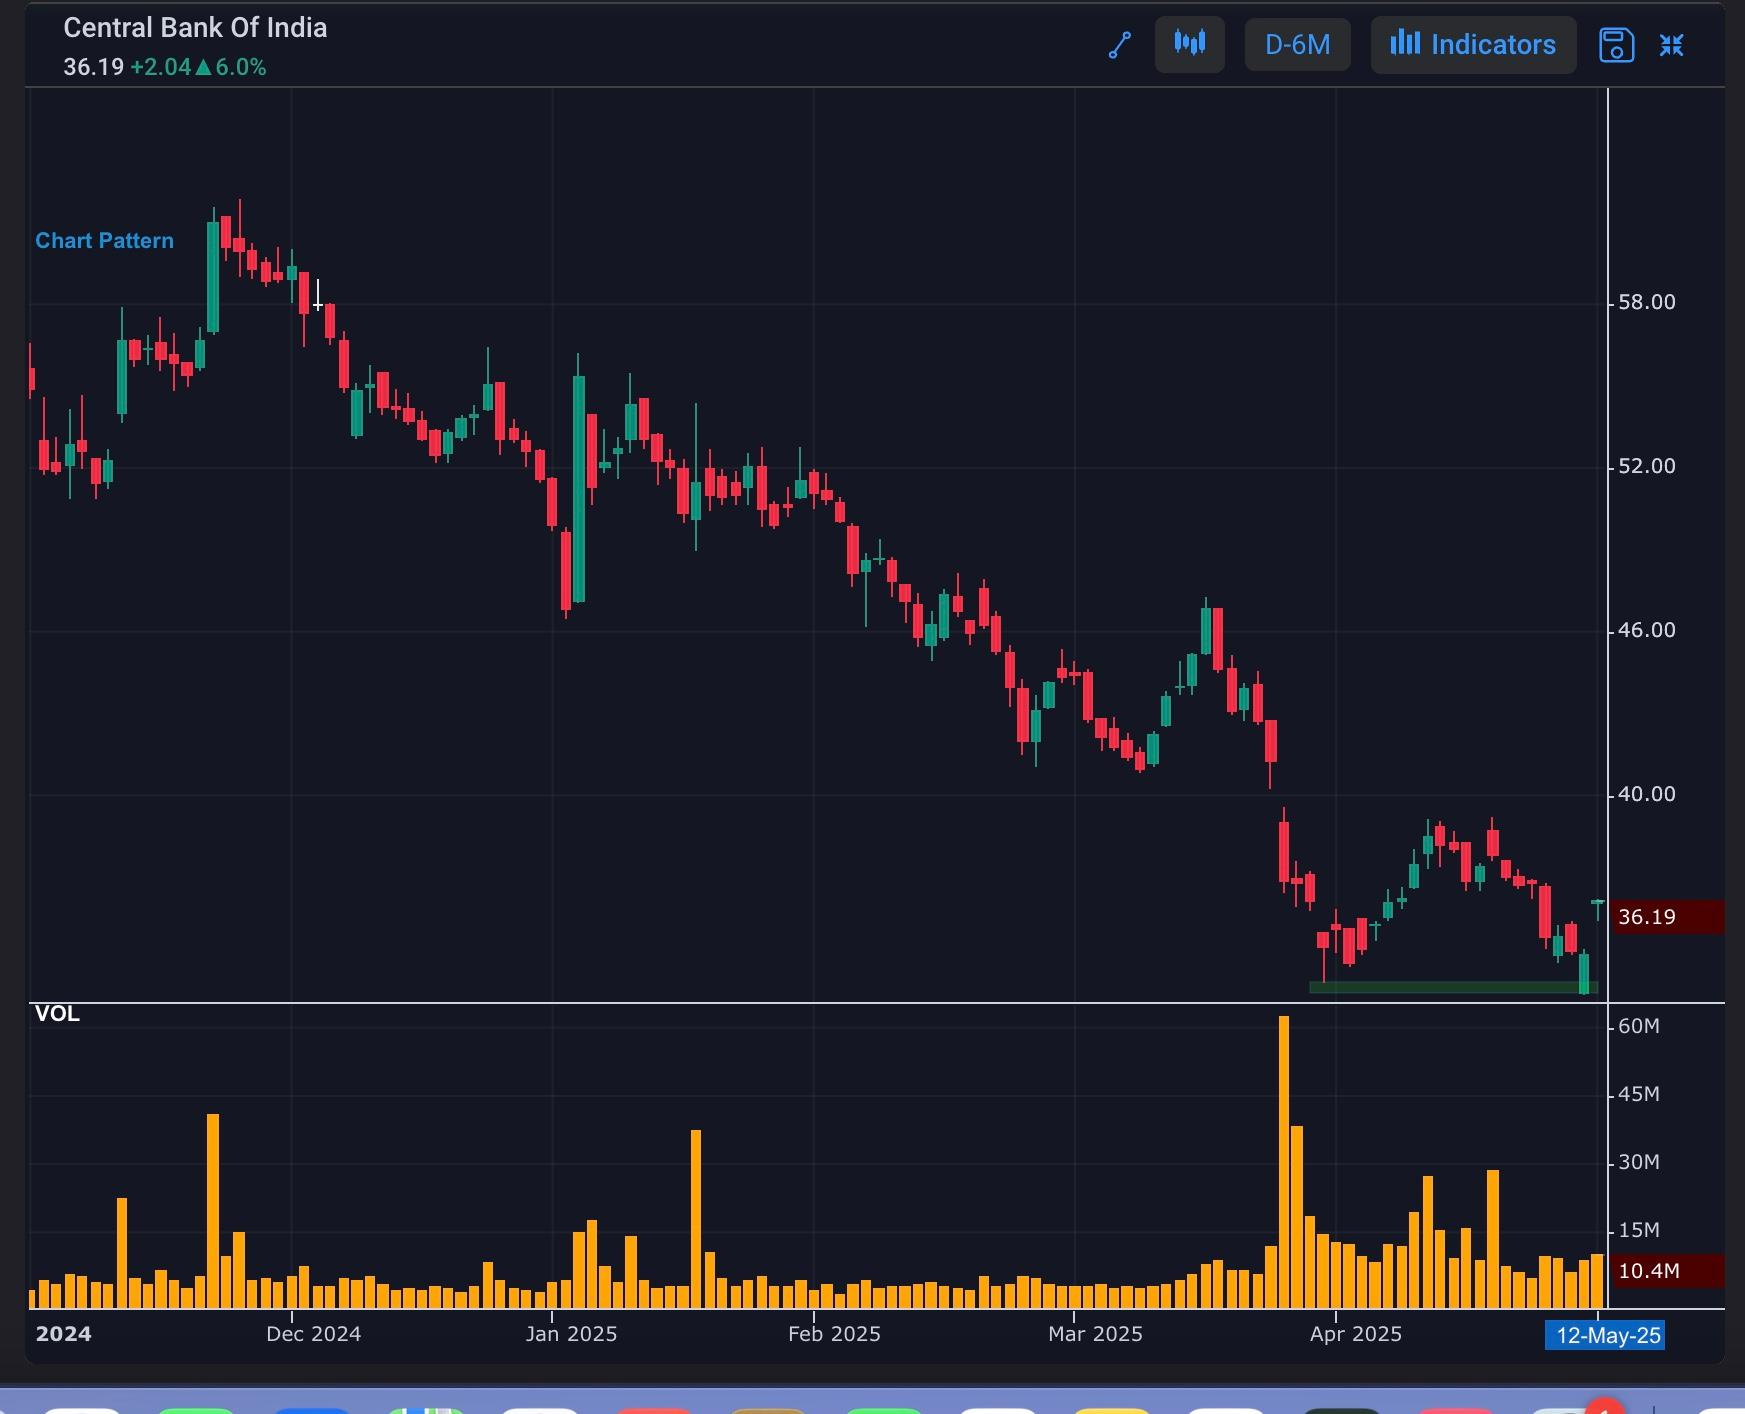
A double bottom is a bullish reversal chart pattern that forms when a stock's price:
1. Falls to a low (first bottom)
2. Rallies to a resistance level
3. Falls again to a low (second bottom) that is roughly equal to the first low
4. Rallies again, breaking above the resistance level
This pattern indicates a potential change in trend from bearish to bullish.
Key Characteristics:
1. Symmetry: The two bottoms should be roughly equal in price.
2. Depth: The second bottom should not be significantly lower than the first bottom.
3. Volume: The rally between the two bottoms and the breakout should be accompanied by increased volume.
Trading Strategy:
1. Buy signal: Buy the stock when it breaks out above the resistance level.
2. Stop-loss: Set a stop-loss below the second bottom.
3. Target: Set a target price based on the chart pattern, such as the height of the pattern added to the breakout price.