



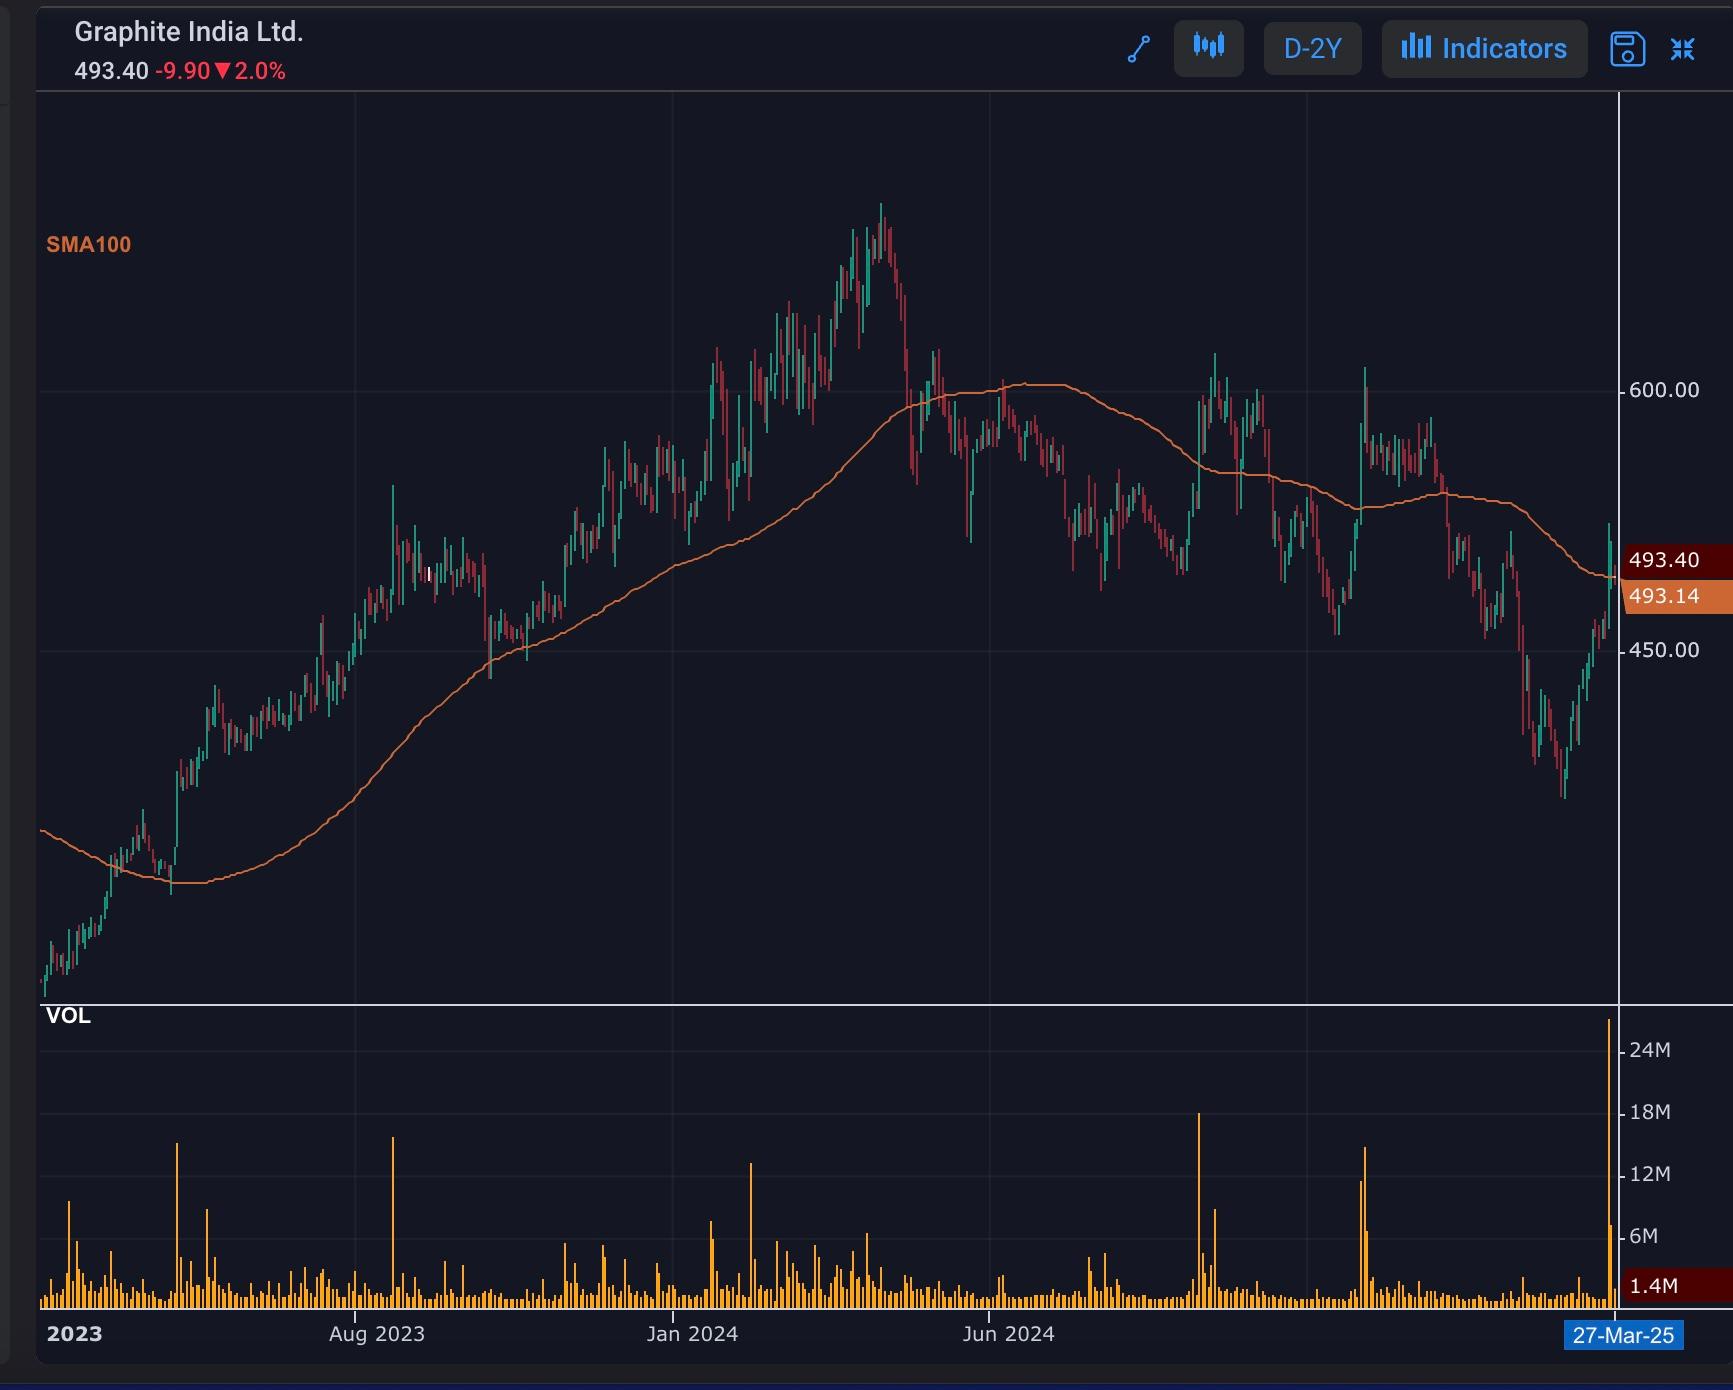
Close near 100 day sma
GRAPHITE
A close above the 100-day SMA may indicate a bullish trend, while a close below may suggest a bearish trend. Traders and investors should monitor this development closely, as it may impact future price movements. A breakout or breakdown from this level could trigger new trading opportunities.
#TechnicalViews#EquityResearch#WatchOutFor
287 likes·61 comments