



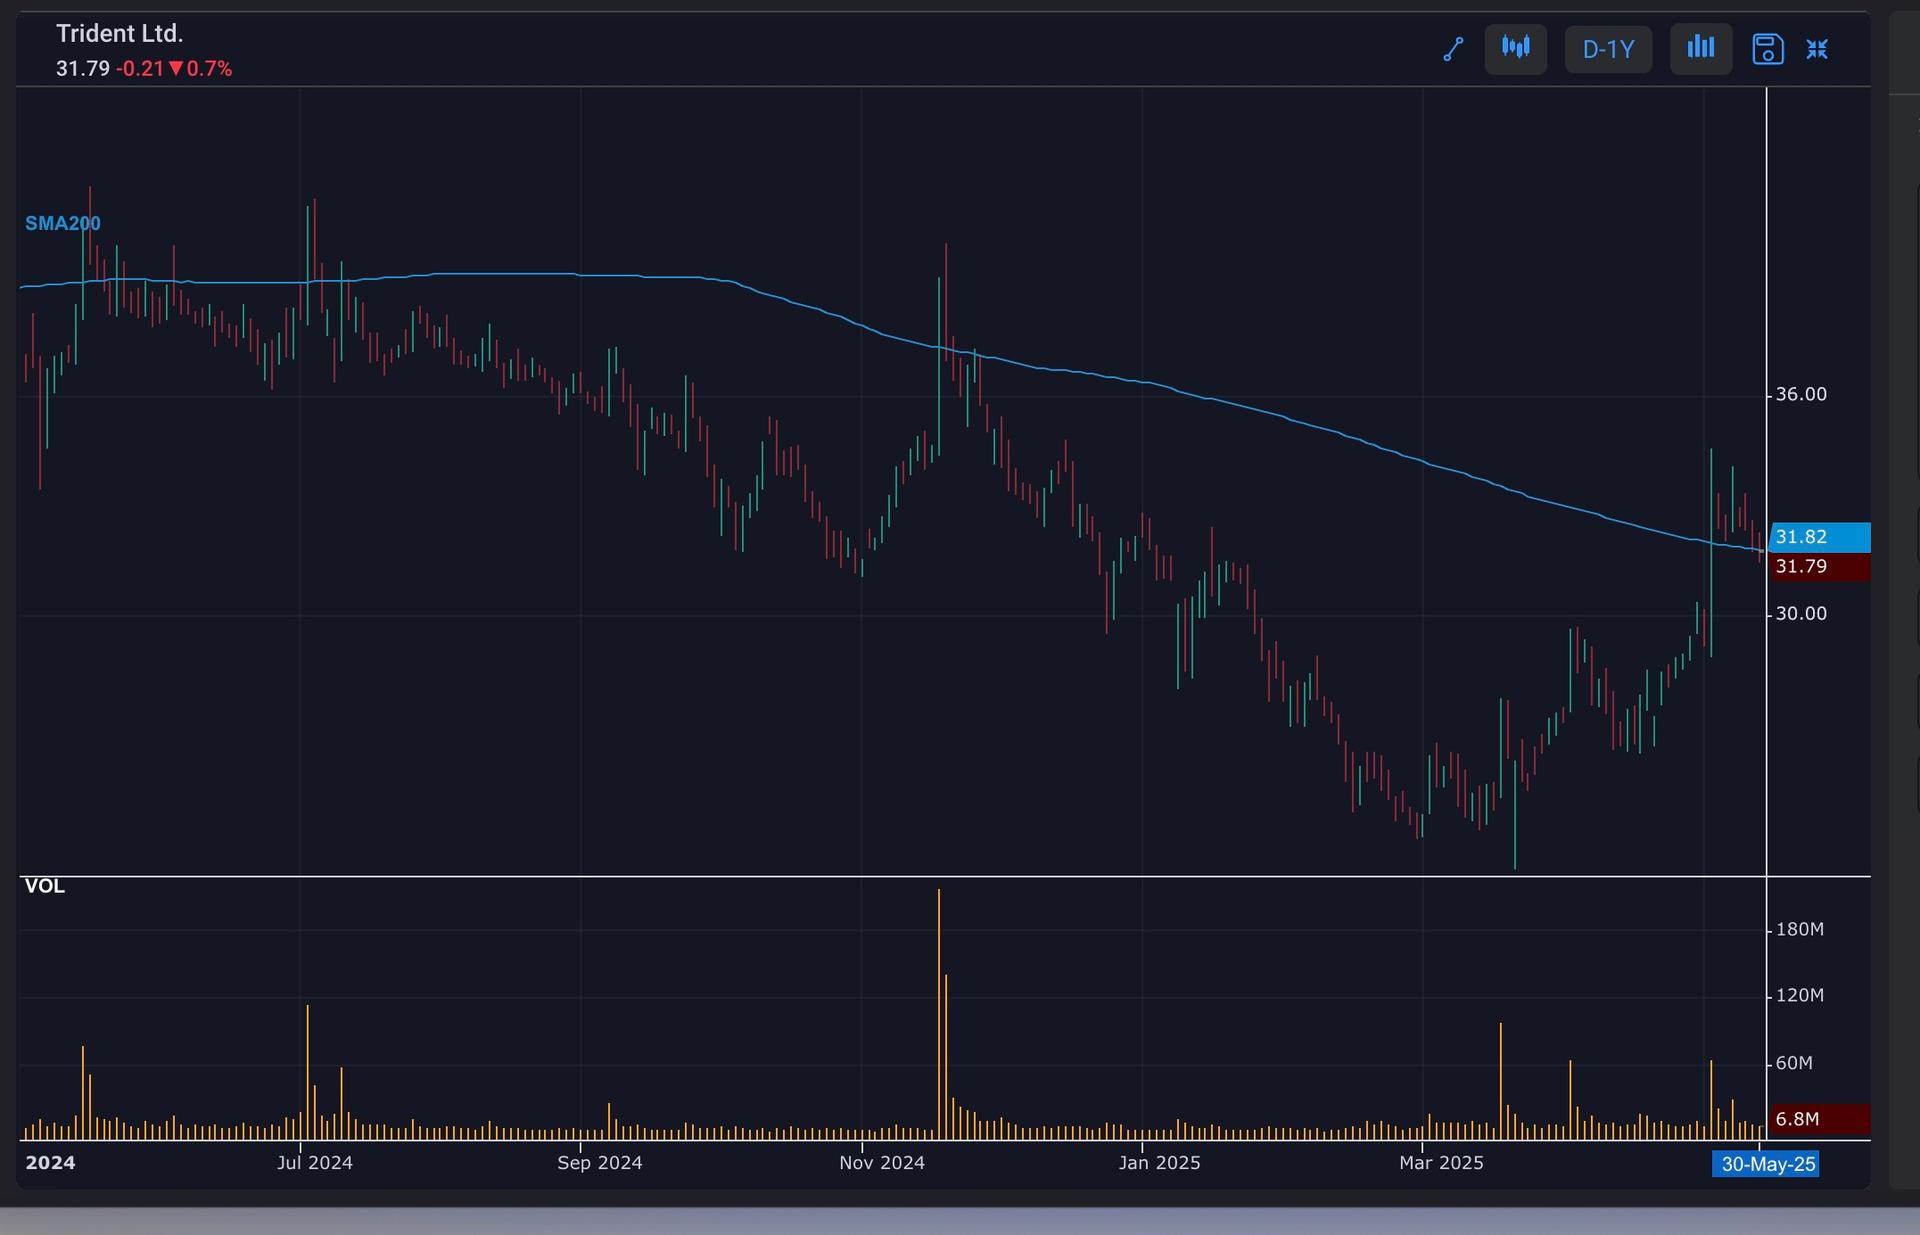
Close near 200 day SMA
TRIDENT
When a stock closes near its 200-day Simple Moving Average (SMA), it's a significant technical indicator. The 200-day SMA represents the stock's long-term trend, and a close near this level suggests that the stock is trading in line with its long-term average. This can be a buying opportunity, as it may indicate a potential reversal or continuation of the uptrend. Traders should confirm this signal with other technical indicators, such as the Relative Strength Index (RSI) and Bollinger Bands. A close near the 200-day SMA can provide a solid foundation for a trading strategy, helping traders ride the long-term trend.
#TechnicalViews#WatchOutFor
252 likes·64 comments