



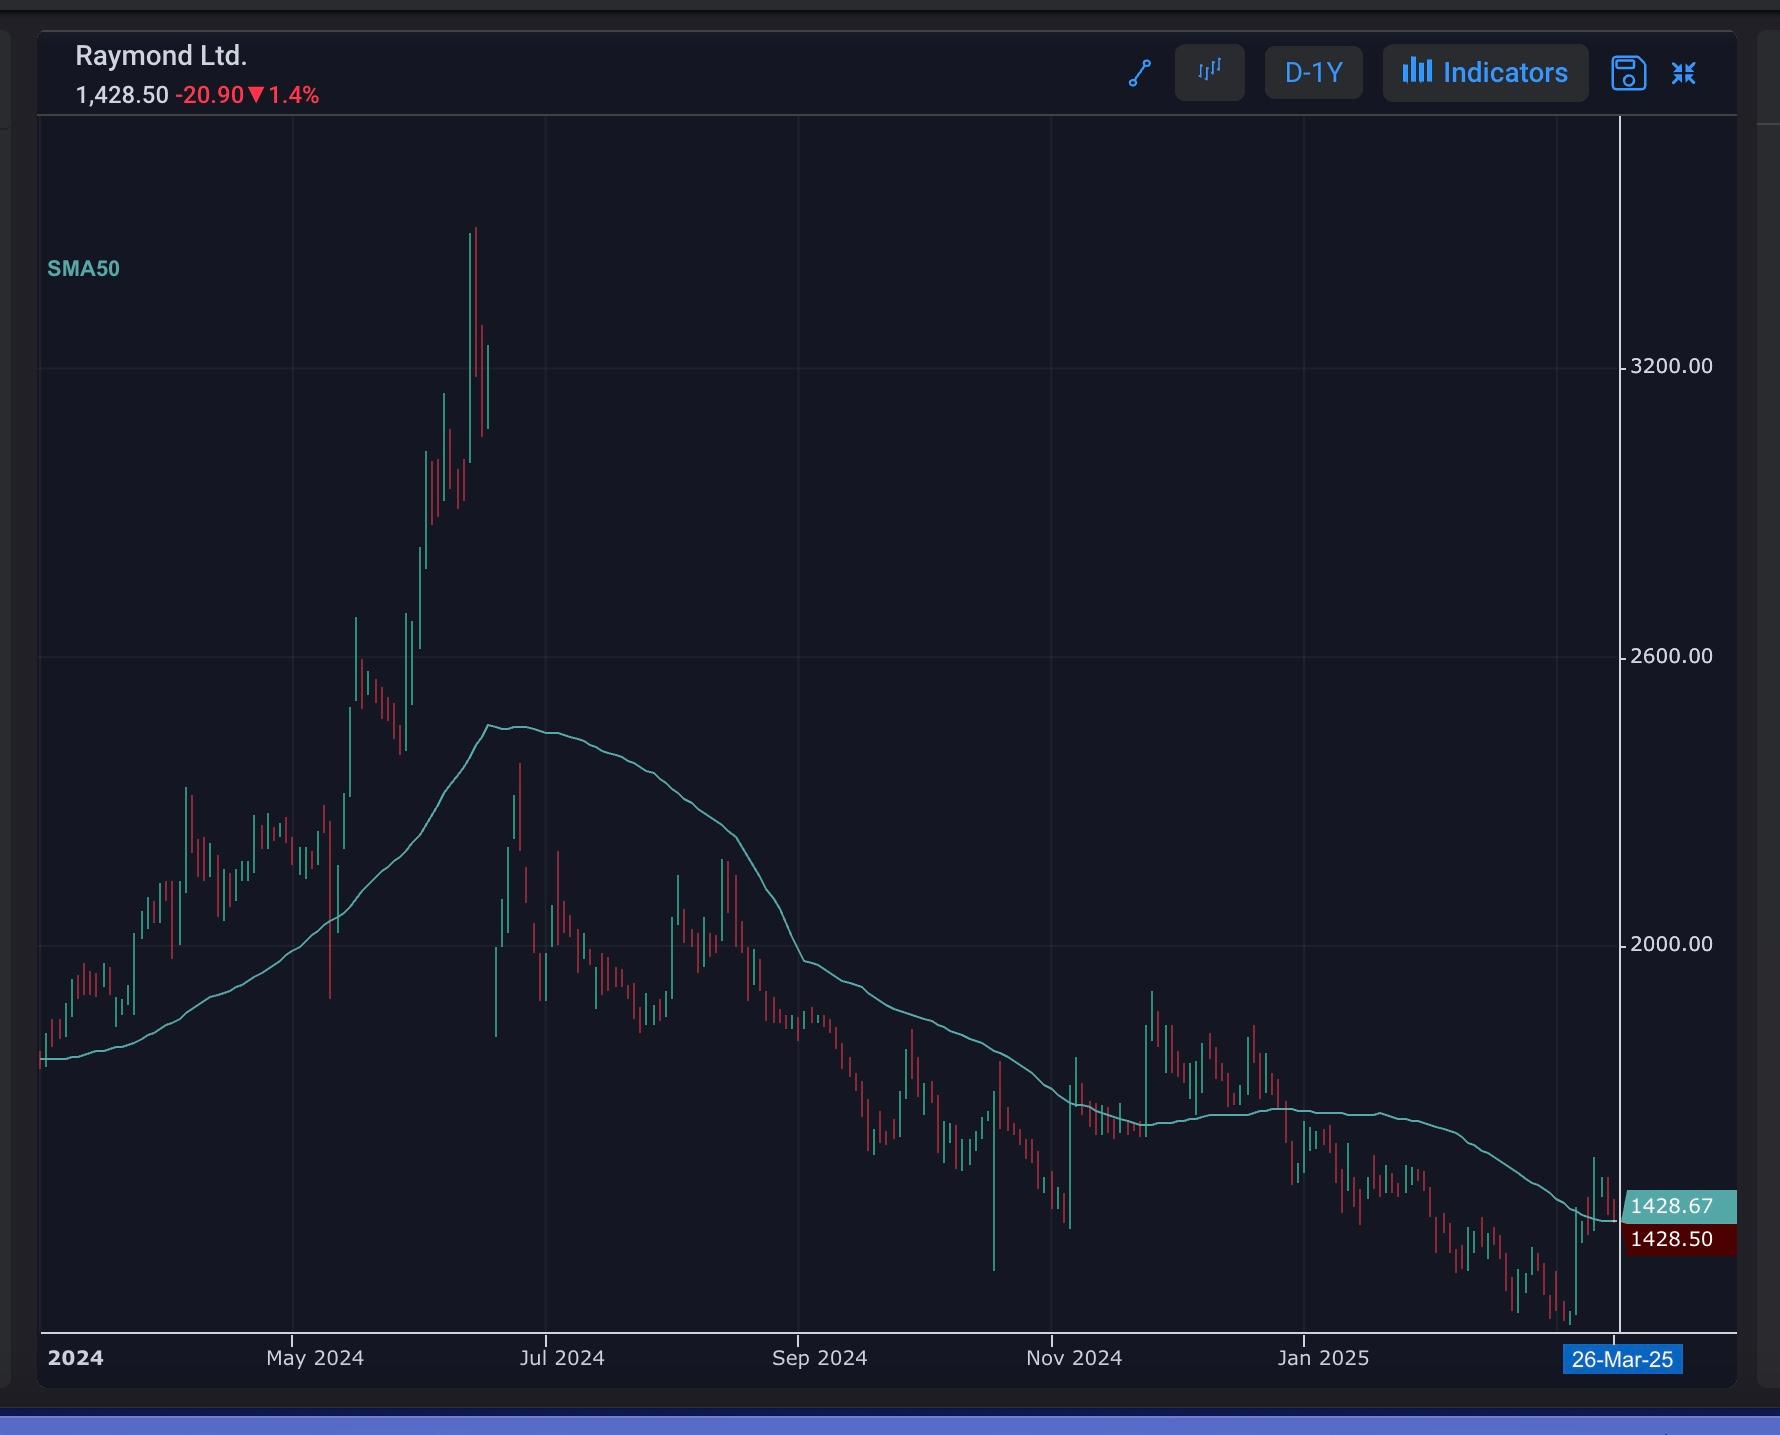
Close near 50 day SMA
RAYMOND
stock has closed near its 50-day simple moving average (SMA), a key technical indicator. This move suggests the stock is regaining strength and momentum. The 50-day SMA is a crucial support level, and a close near this level indicates a potential buying opportunity. As the stock continues to trade near this level, investors and traders are watching for a breakout or a pullback. A move above the 50-day SMA could signal a bullish trend reversal.
#WatchOutFor#TechnicalViews#EquityResearch
182 likes·56 comments