



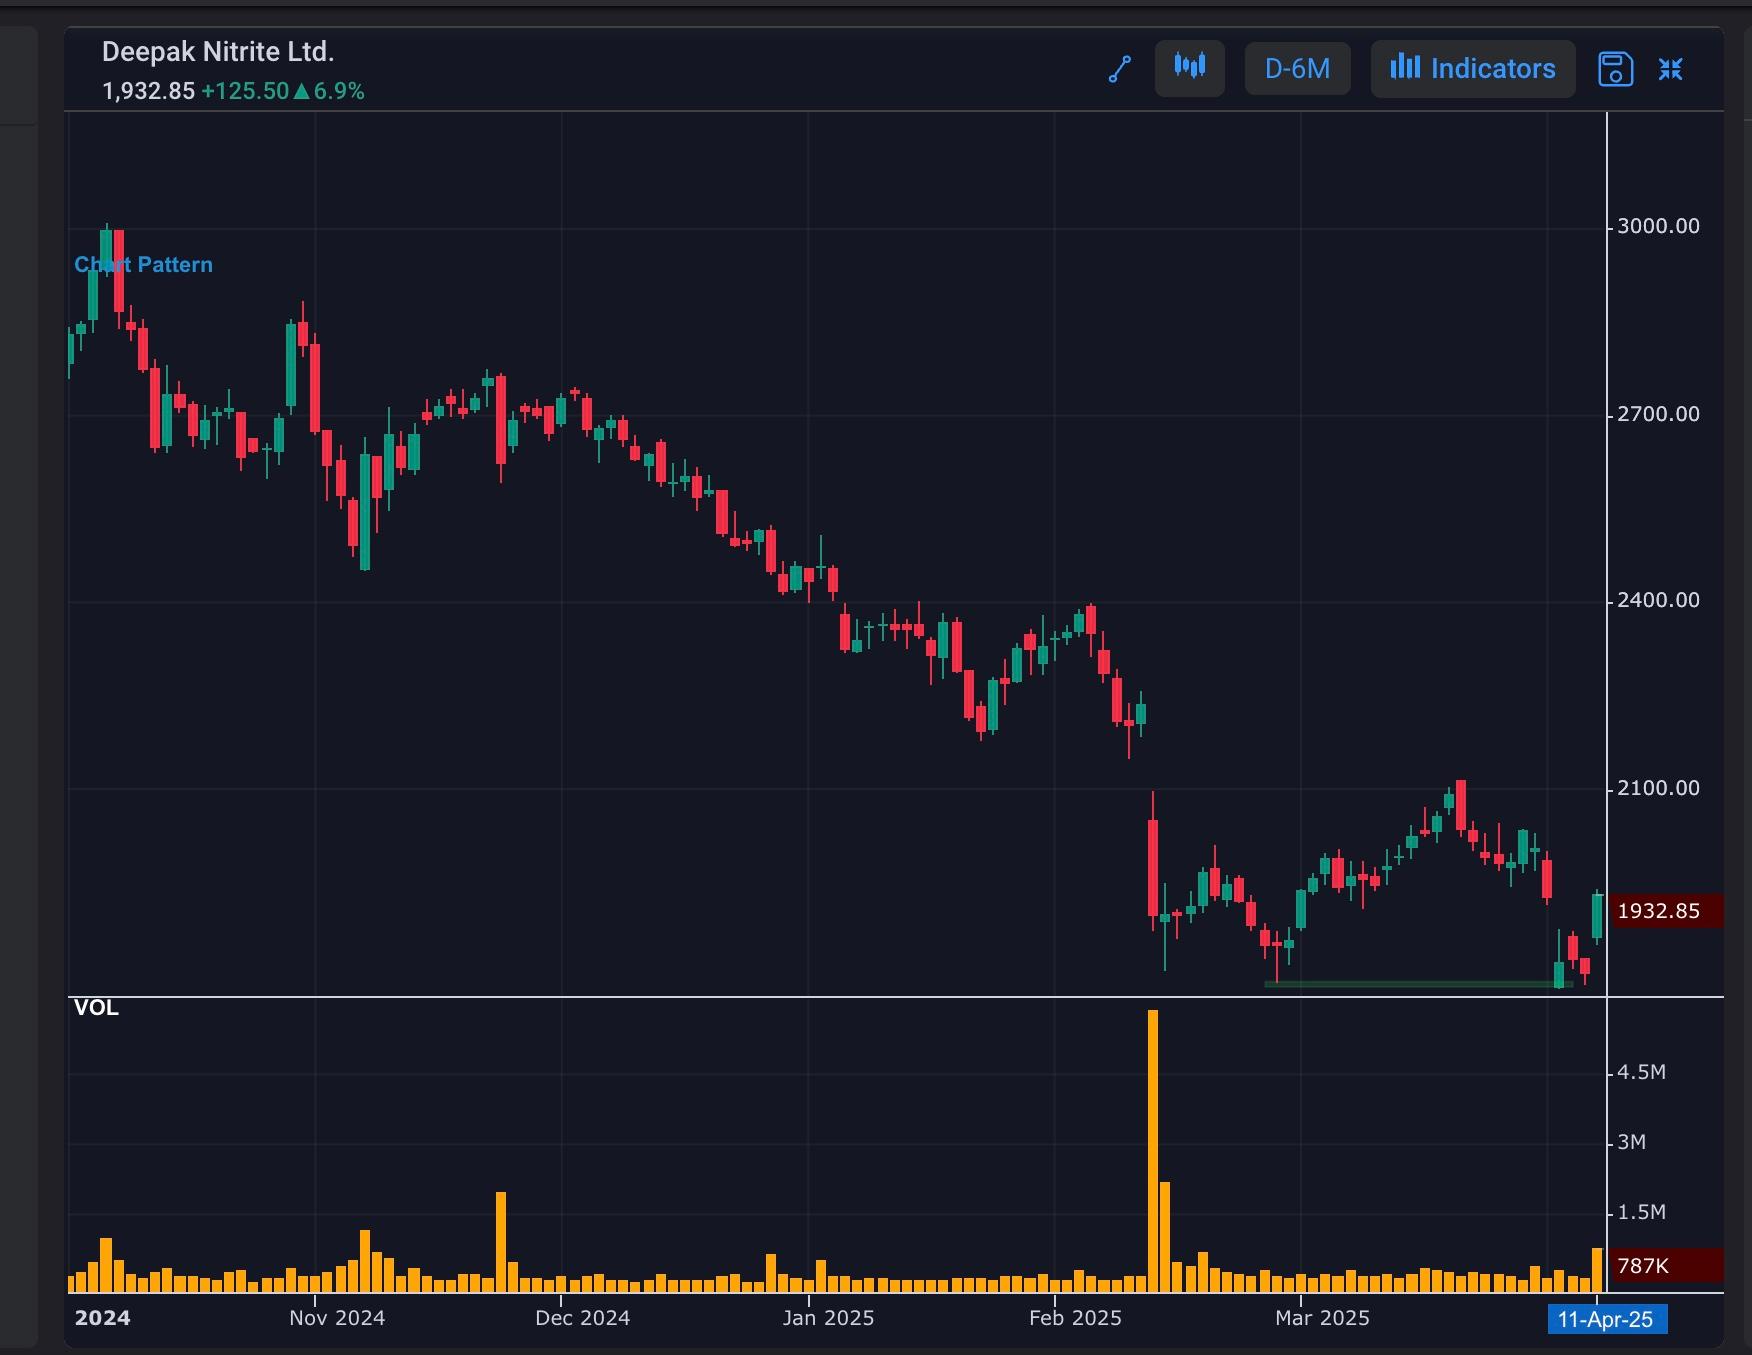
Double bottom
DEEPAKNTR
A double bottom pattern is a bullish reversal formation that occurs when a stock's price:
1. Falls to a low, then bounces back.
2. Falls to a similar low again, finding support.
3. Breaks out above the resistance level.
Key implications:
1. Strong support level: The stock has found support at a specific level twice.
2. Potential trend reversal: A breakout above resistance can signal a shift from bearish to bullish.
Trading opportunities:
1. Buying above the resistance level.
2. Confirming the pattern with increased volume.
This pattern suggests the stock may reverse its downtrend and move higher.
#WatchOutFor#TechnicalViews
130 likes·87 comments