



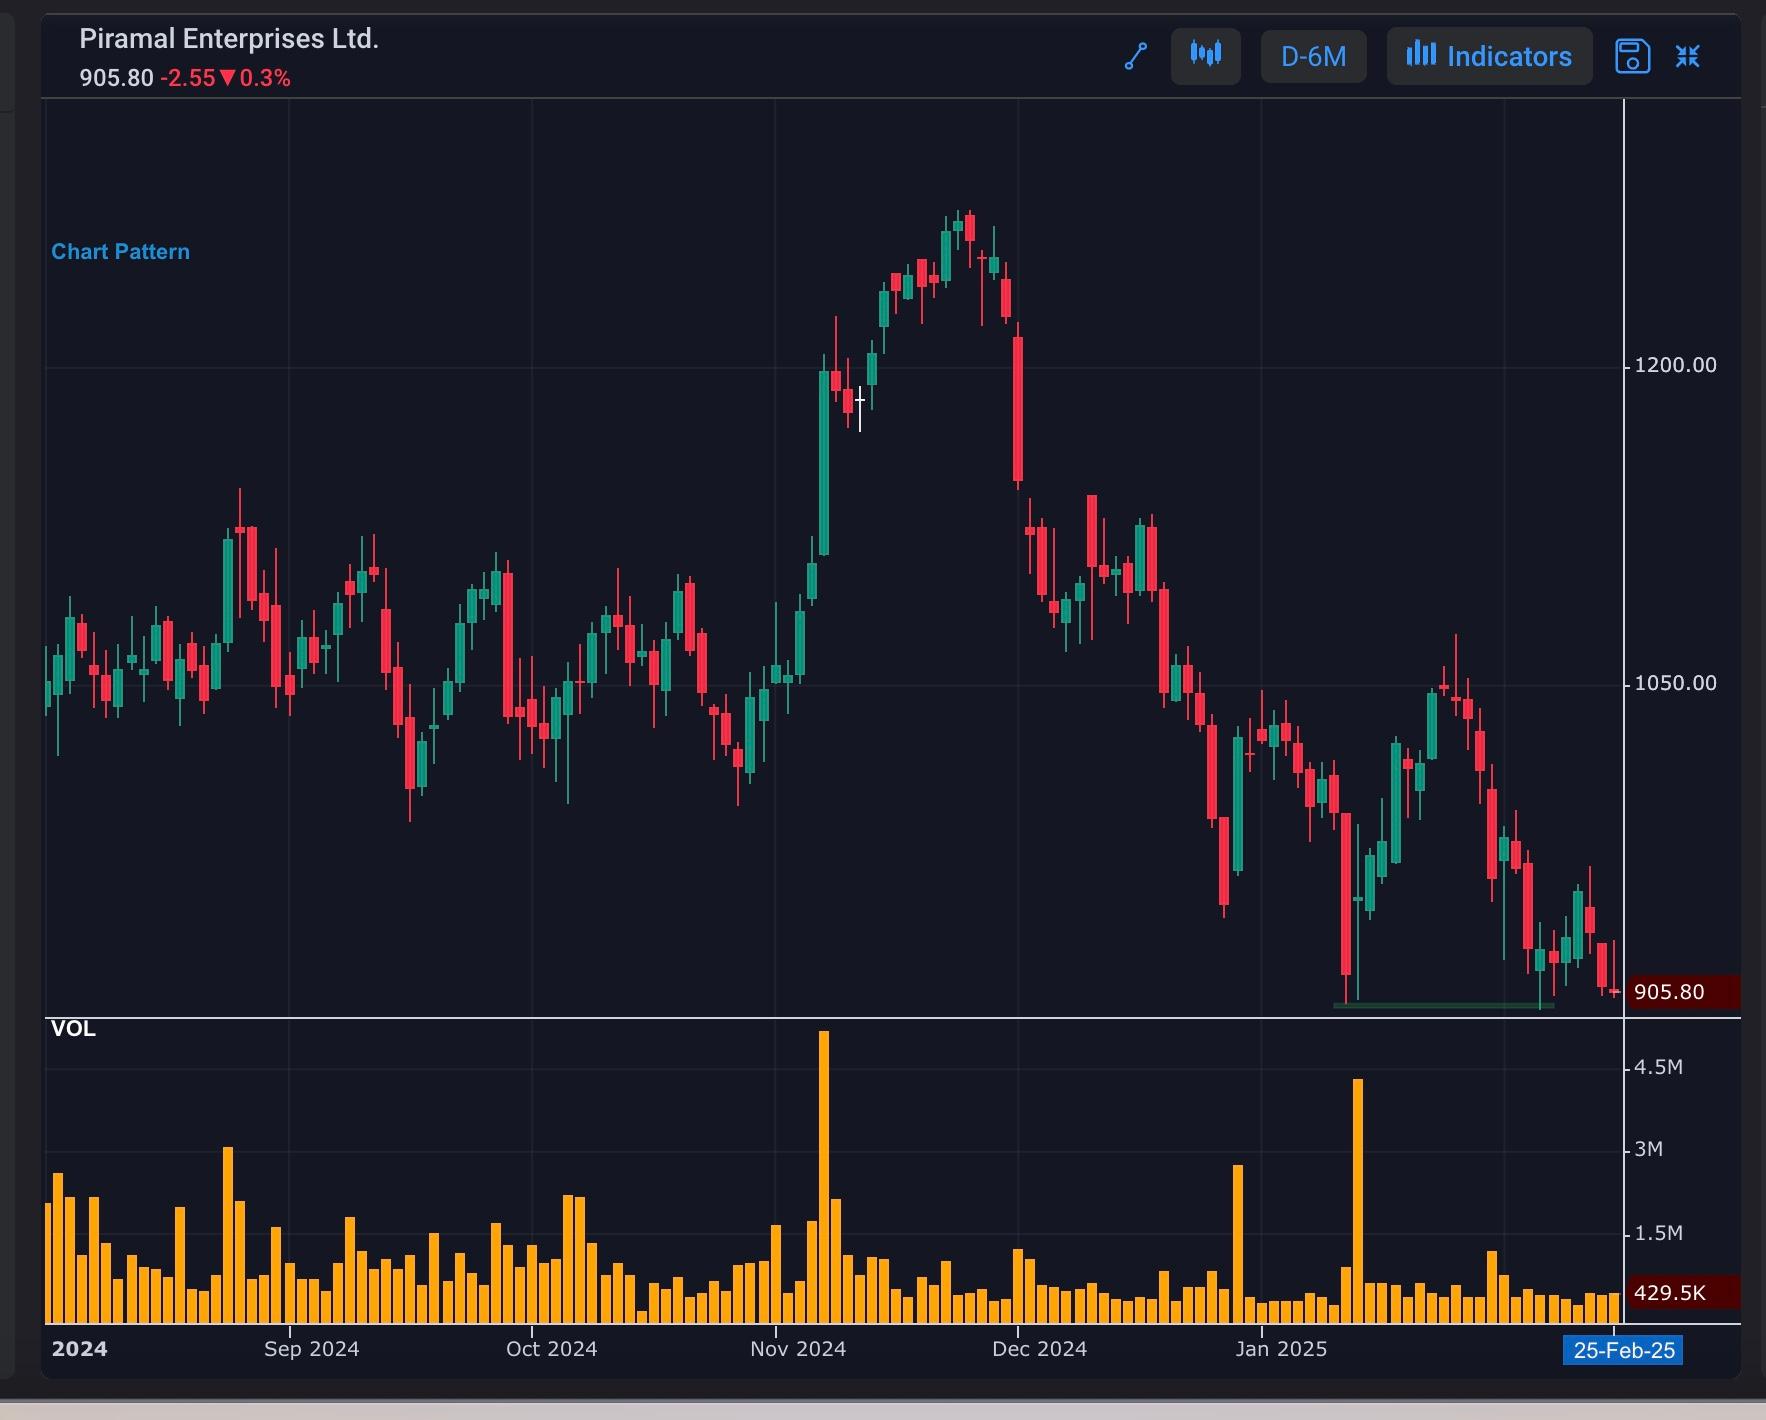
Double Bottom: A Bullish Reversal Pattern
PEL
A double bottom is a chart pattern that signals a potential trend reversal. It forms when a stock's price drops to a support level, bounces back up, and then drops again to the same support level before bouncing back up again. This pattern indicates that buyers are absorbing selling pressure, and a bullish reversal may be imminent. A close above the resistance level confirms the pattern, making it a reliable buy signal. Traders can capitalize on this pattern by buying at the breakout point and riding the upward momentum.
#WatchOutFor#EquityResearch#TechnicalViews
112 likes·68 comments