



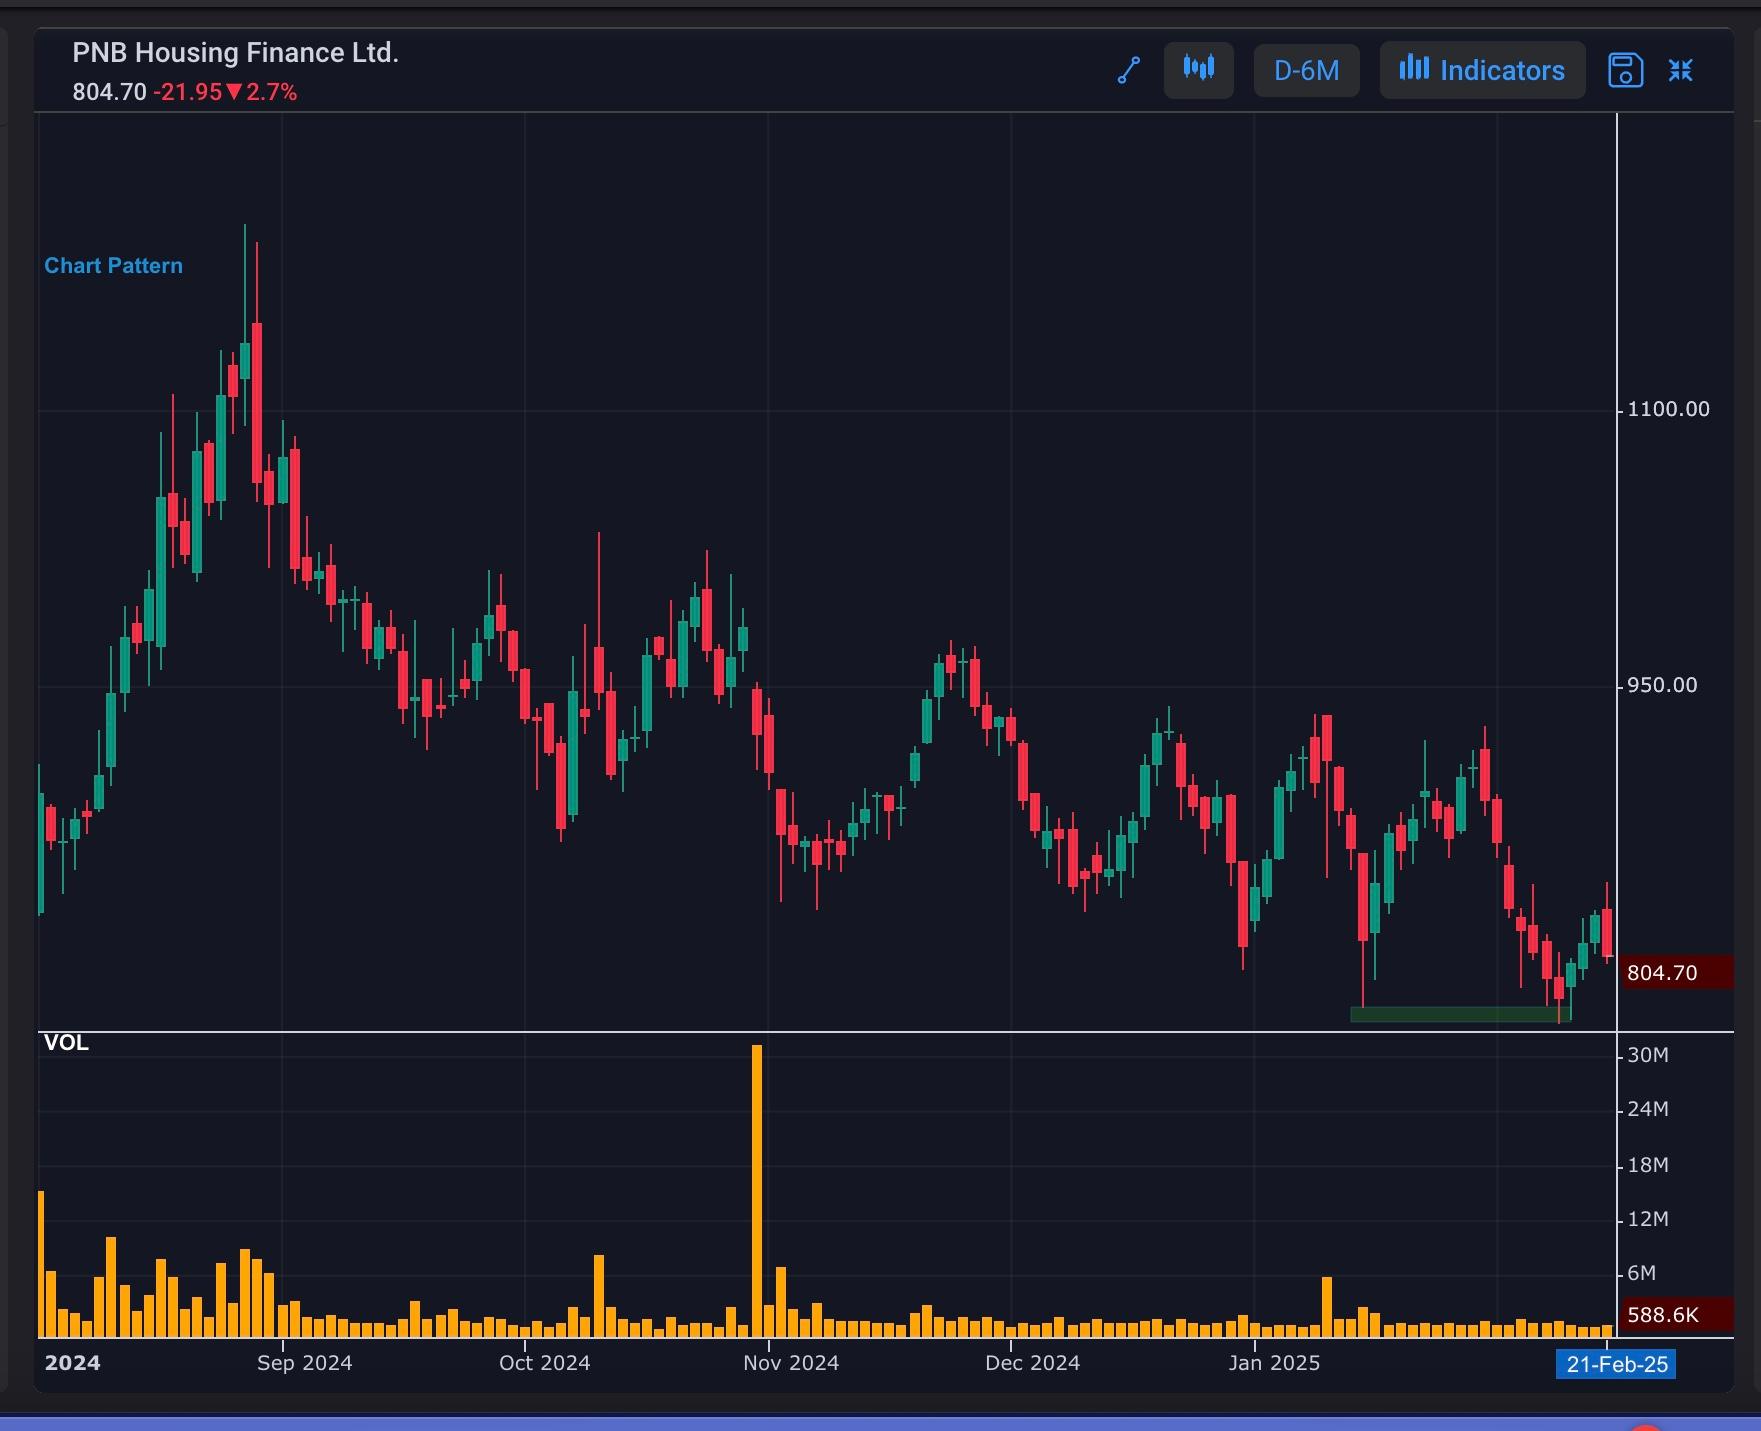
Double bottom
PNBHOUSING
A double bottom chart pattern has formed, signaling a potential bullish reversal in the market. This pattern occurs when a stock's price falls to a support level, bounces back, and then falls again to the same level before rebounding.
The double bottom pattern indicates a strong buying interest at the support level, which could lead to a trend reversal. Traders should watch for a breakout above the pattern's resistance level, which could confirm the reversal and provide a buying opportunity.
#WatchOutFor#EquityResearch#TechnicalViews
126 likes·89 comments