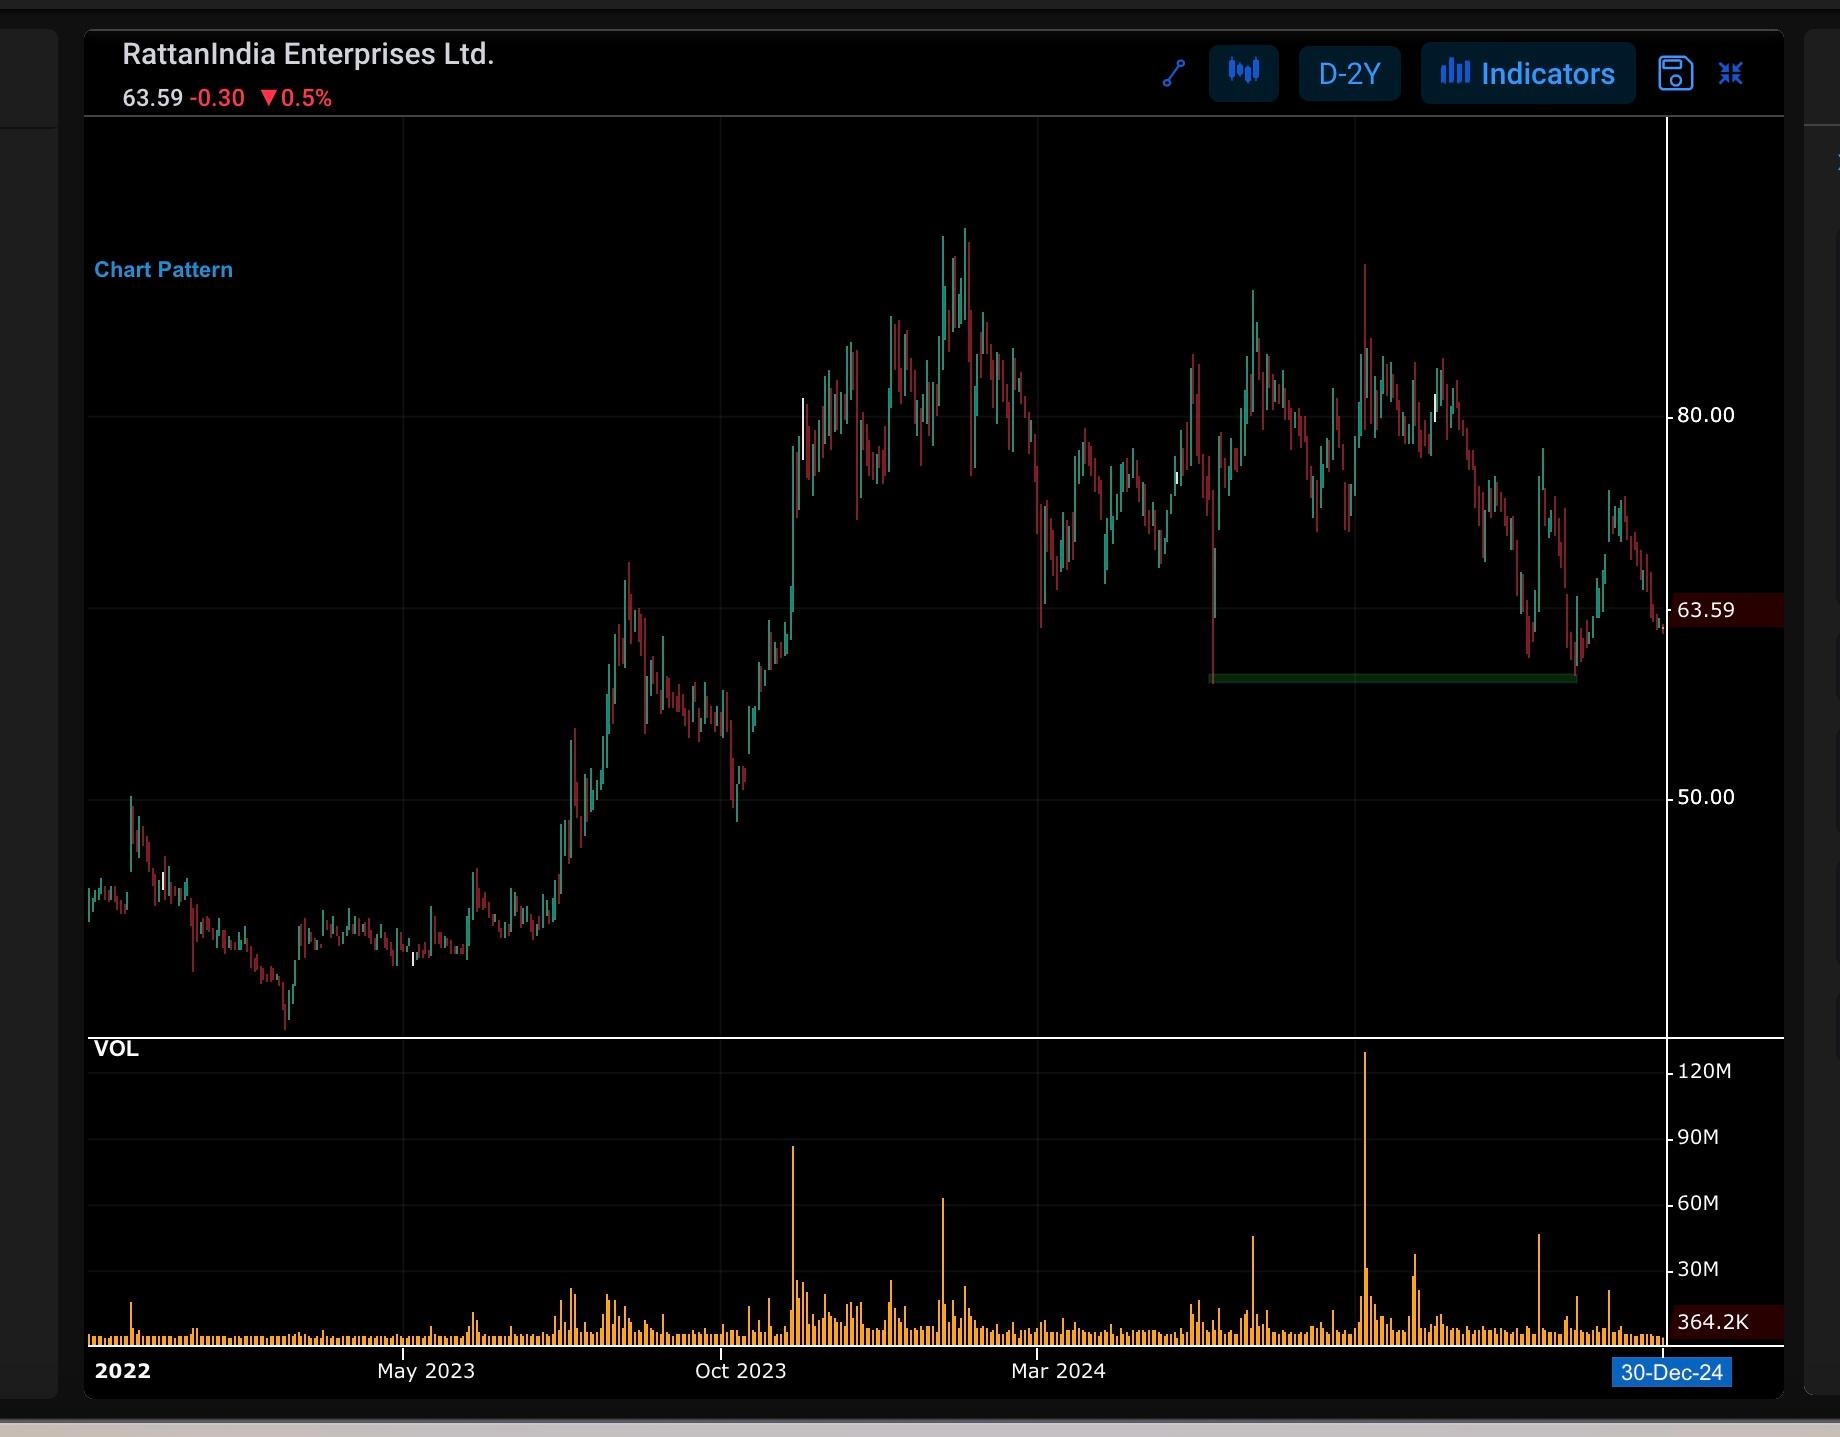
The double bottom pattern is a technical analysis chart pattern that forms when a stock's price reaches a low, pulls back, and then reaches the same low again before reversing. This pattern is considered a bullish reversal pattern, indicating a potential trend change from bearish to bullish.
Characteristics:
1. Two distinct lows: The stock's price forms two distinct lows, with a pullback in between.
2. Similar lows: The two lows reach similar levels, indicating a strong support level.
3. Volume increase: The volume typically increases during the second low, indicating buying interest.
4. Neckline: The neckline is the resistance level that connects the highs between the two lows.
Trading Strategies:
1. Buy on breakout: Buy the stock when it breaks out above the neckline, with a stop-loss below the recent low.
2. Long on reversal: Go long on the stock when it reverses from the second low, with a stop-loss below the recent low.
3. Monitor and adjust: Continuously monitor the stock's price action and adjust your trading strategy as needed.
Limitations:
1. False signals: The double bottom pattern can produce false signals, especially during periods of high market volatility.
2. Confirmation required: Use this pattern in conjunction with other technical and fundamental analysis tools to confirm trading decisions.
Important Notes:
1. Pattern duration: The double bottom pattern can take several weeks or even months to form.
2. Neckline strength: A stronger neckline can indicate a more significant breakout.
3. Volume analysis: Increasing volume during the second low can confirm the reversal.