



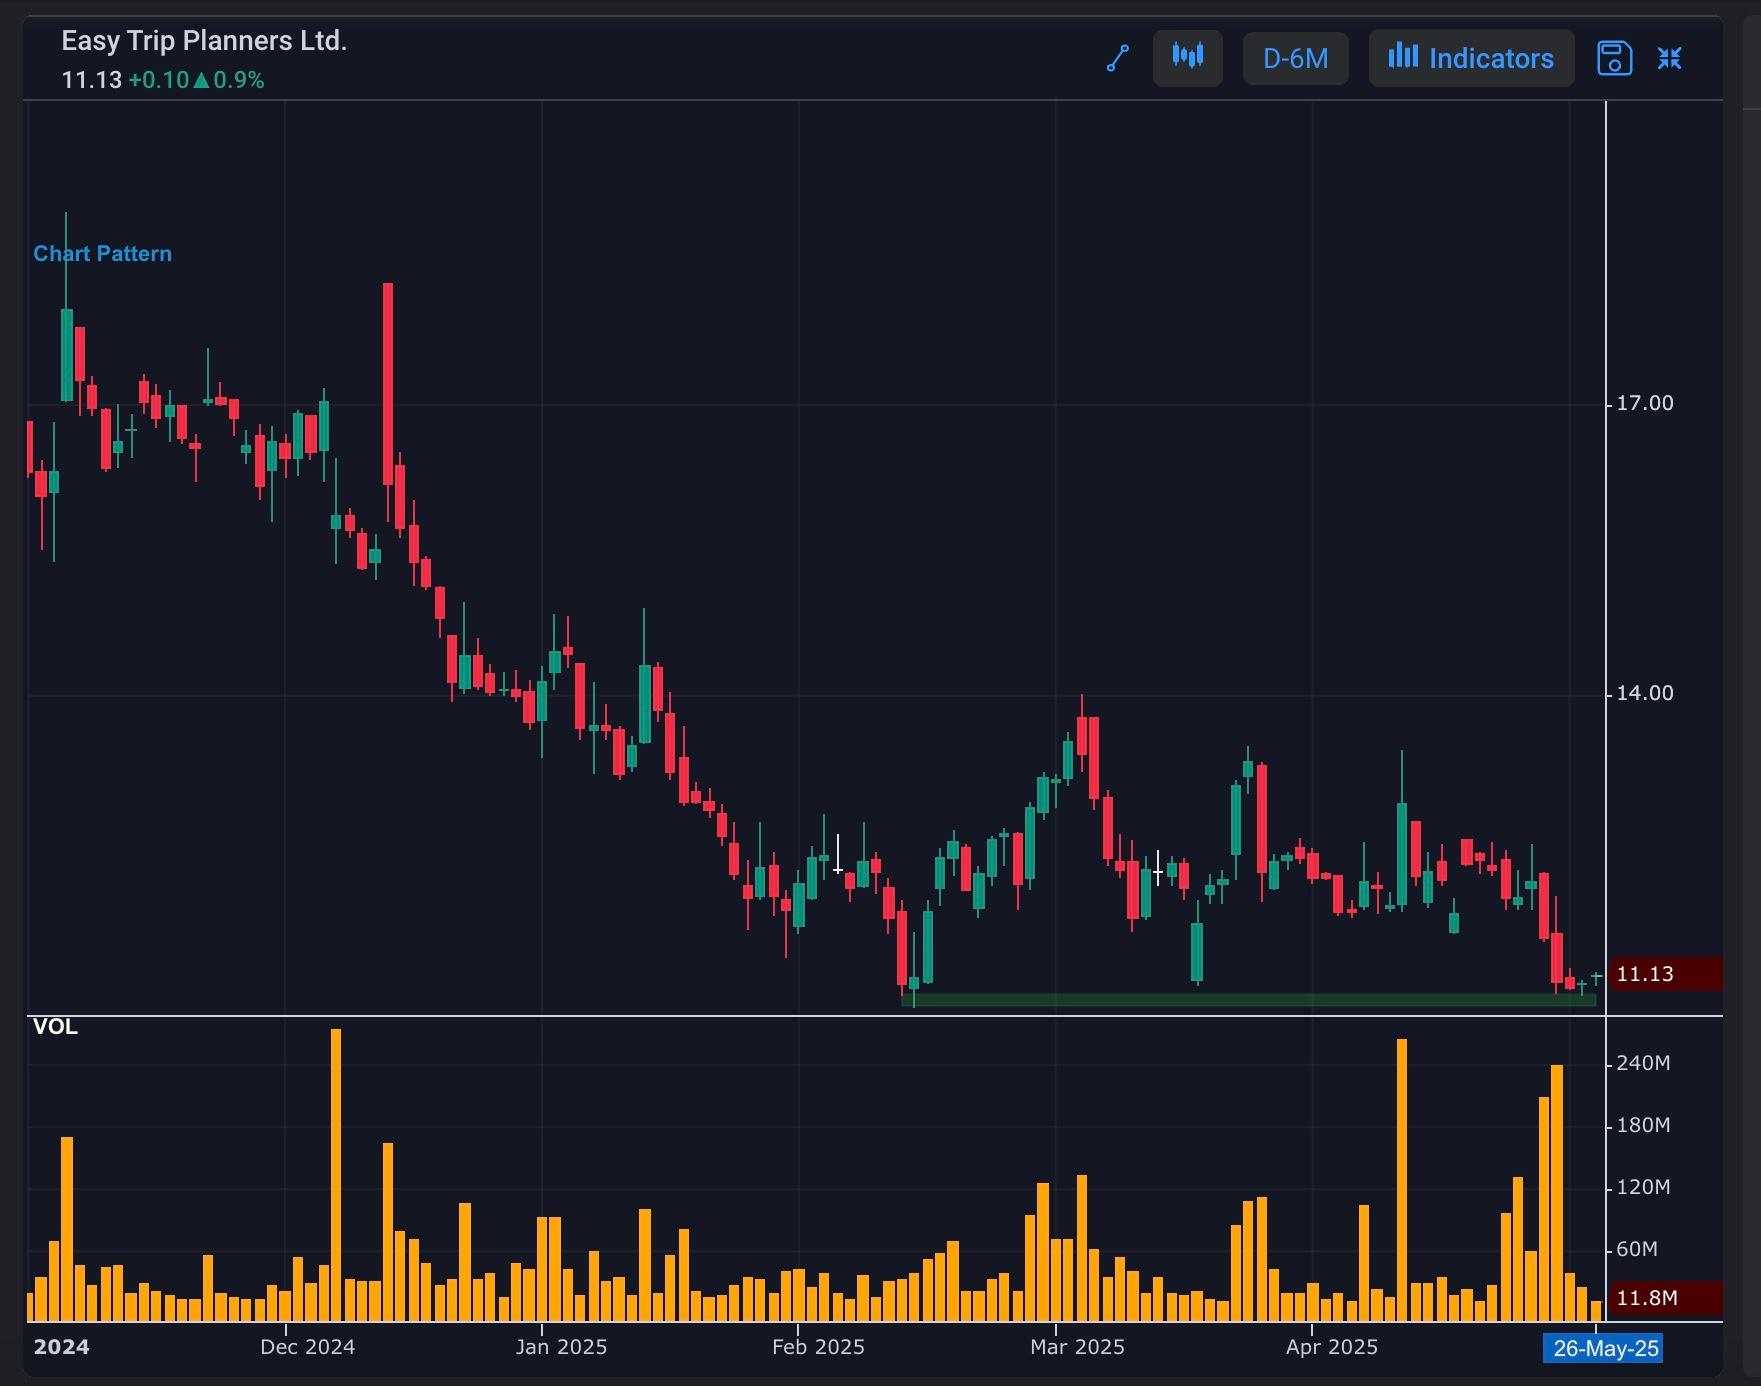
Double bottom pick
EASEMYTRIP
A double bottom is a bullish reversal chart pattern that forms when:
1. Price drops to a low (first bottom).
2. Price bounces back up.
3. Price falls again to a similar low (second bottom).
4. Price rises again, breaking above the middle peak.
Key characteristics:
- Two distinct lows (bottoms) with a peak in between.
- The second bottom is typically similar in price to the first bottom.
- Volume is often higher on the upward breakout.
Trading implications:
- Double bottom patterns can indicate a potential trend reversal.
- A breakout above the middle peak can confirm the reversal.
- Traders may buy on the breakout or use the pattern as a stop-loss level.
#TechnicalViews#WatchOutFor
287 likes·77 comments