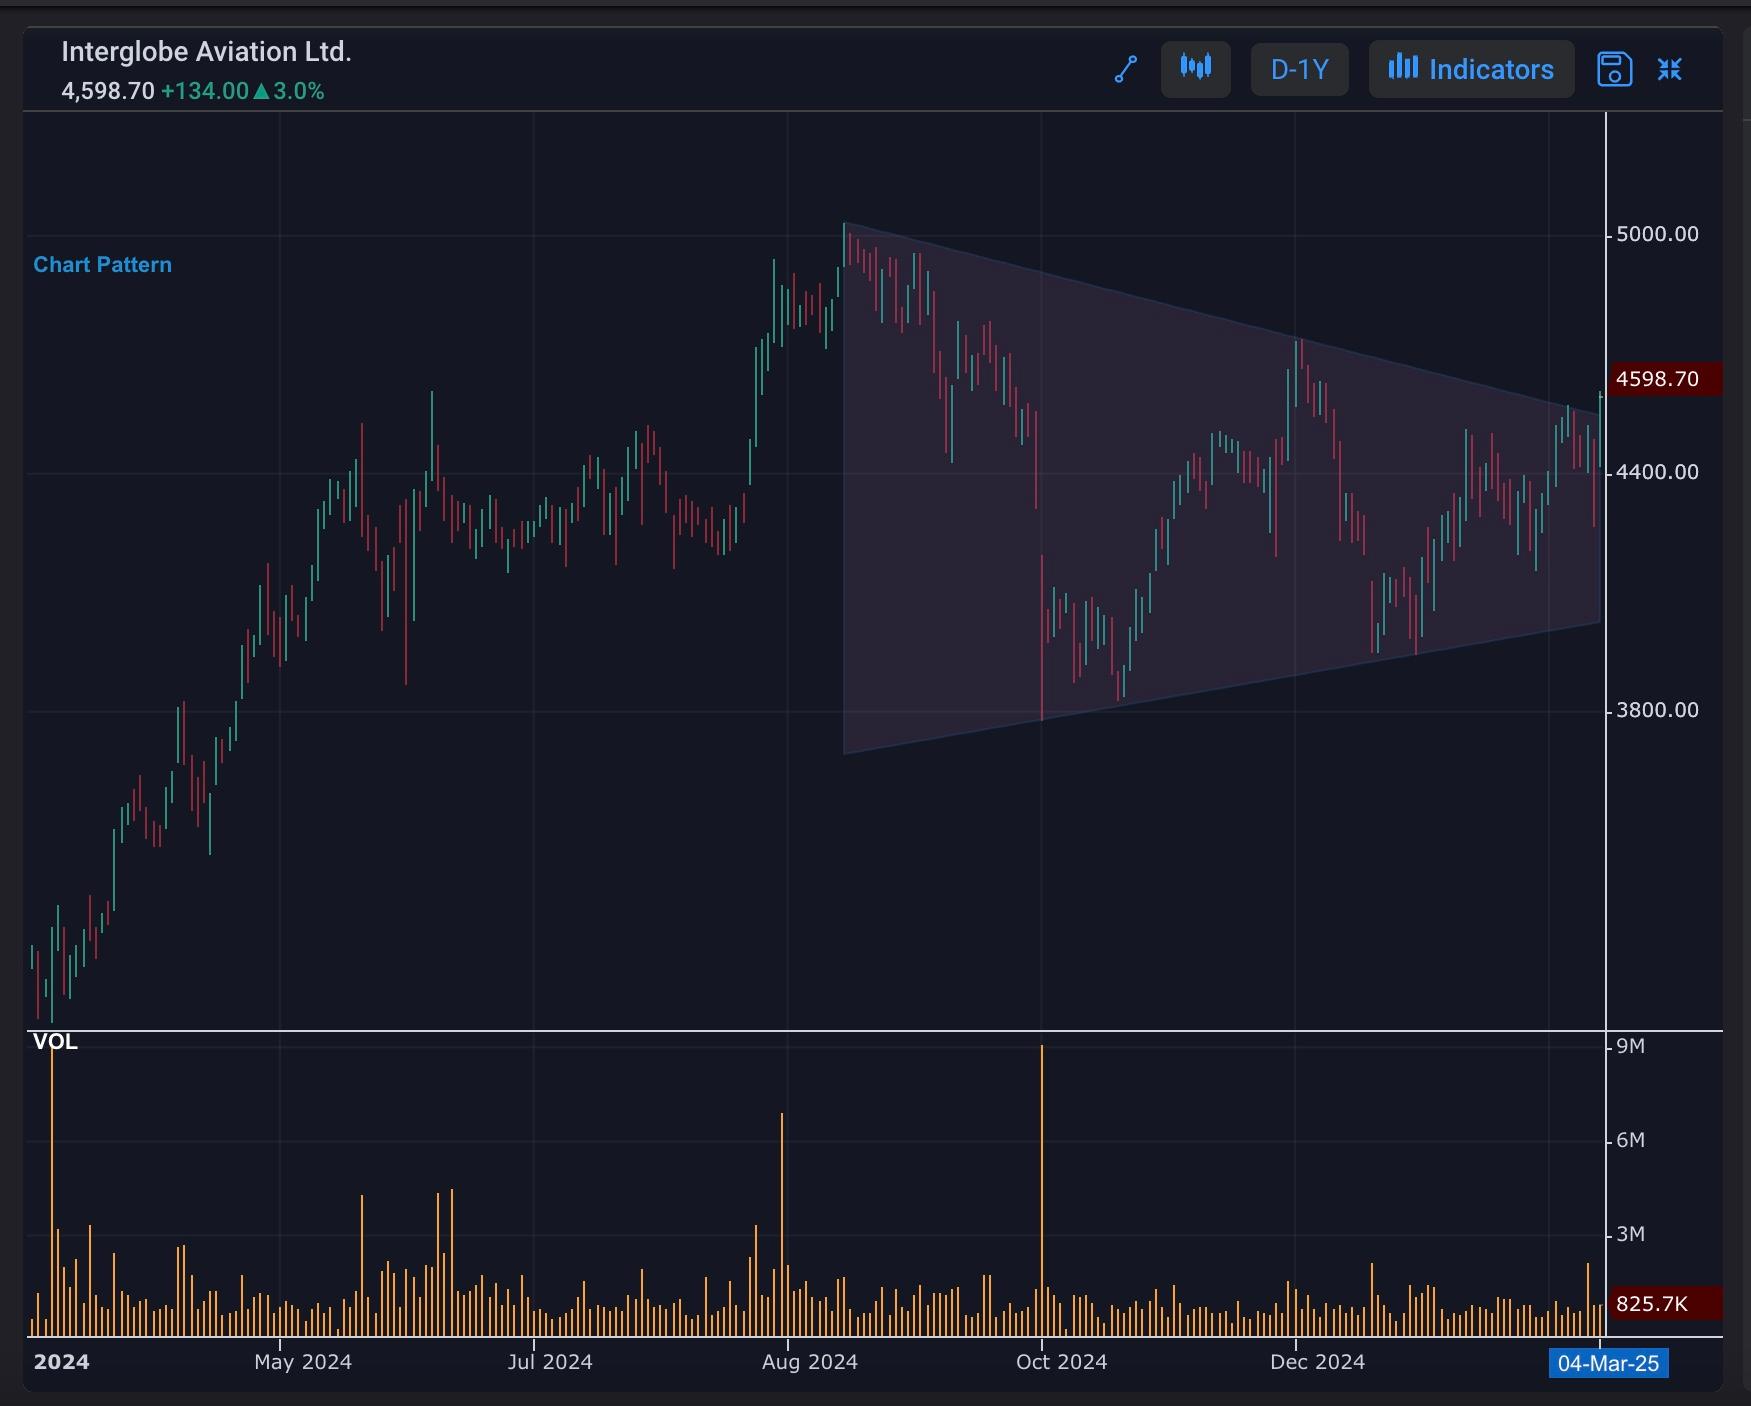
A neutral chart pattern indicates a balance between buyers and sellers, with no clear trend or direction. Here are some key points:
Characteristics
1. Lack of Trend: No clear uptrend or downtrend.
2. Consolidation: Prices move sideways within a narrow range.
3. Balance: Buyers and sellers are evenly matched.
Trading Implications
1. Wait for Breakout: Wait for a clear breakout above or below the consolidation range.
2. Avoid Predictions: Avoid predicting the direction of the breakout.
3. Focus on Risk Management: Set stop-losses and limit positions to manage risk.
Examples of Neutral Chart Patterns
1. Rectangle: A rectangular pattern with equal highs and lows.
2. Symmetrical Triangle: A triangle with equal highs and lows, indicating a balance between buyers and sellers.
3. Range: A horizontal range with no clear trend.