



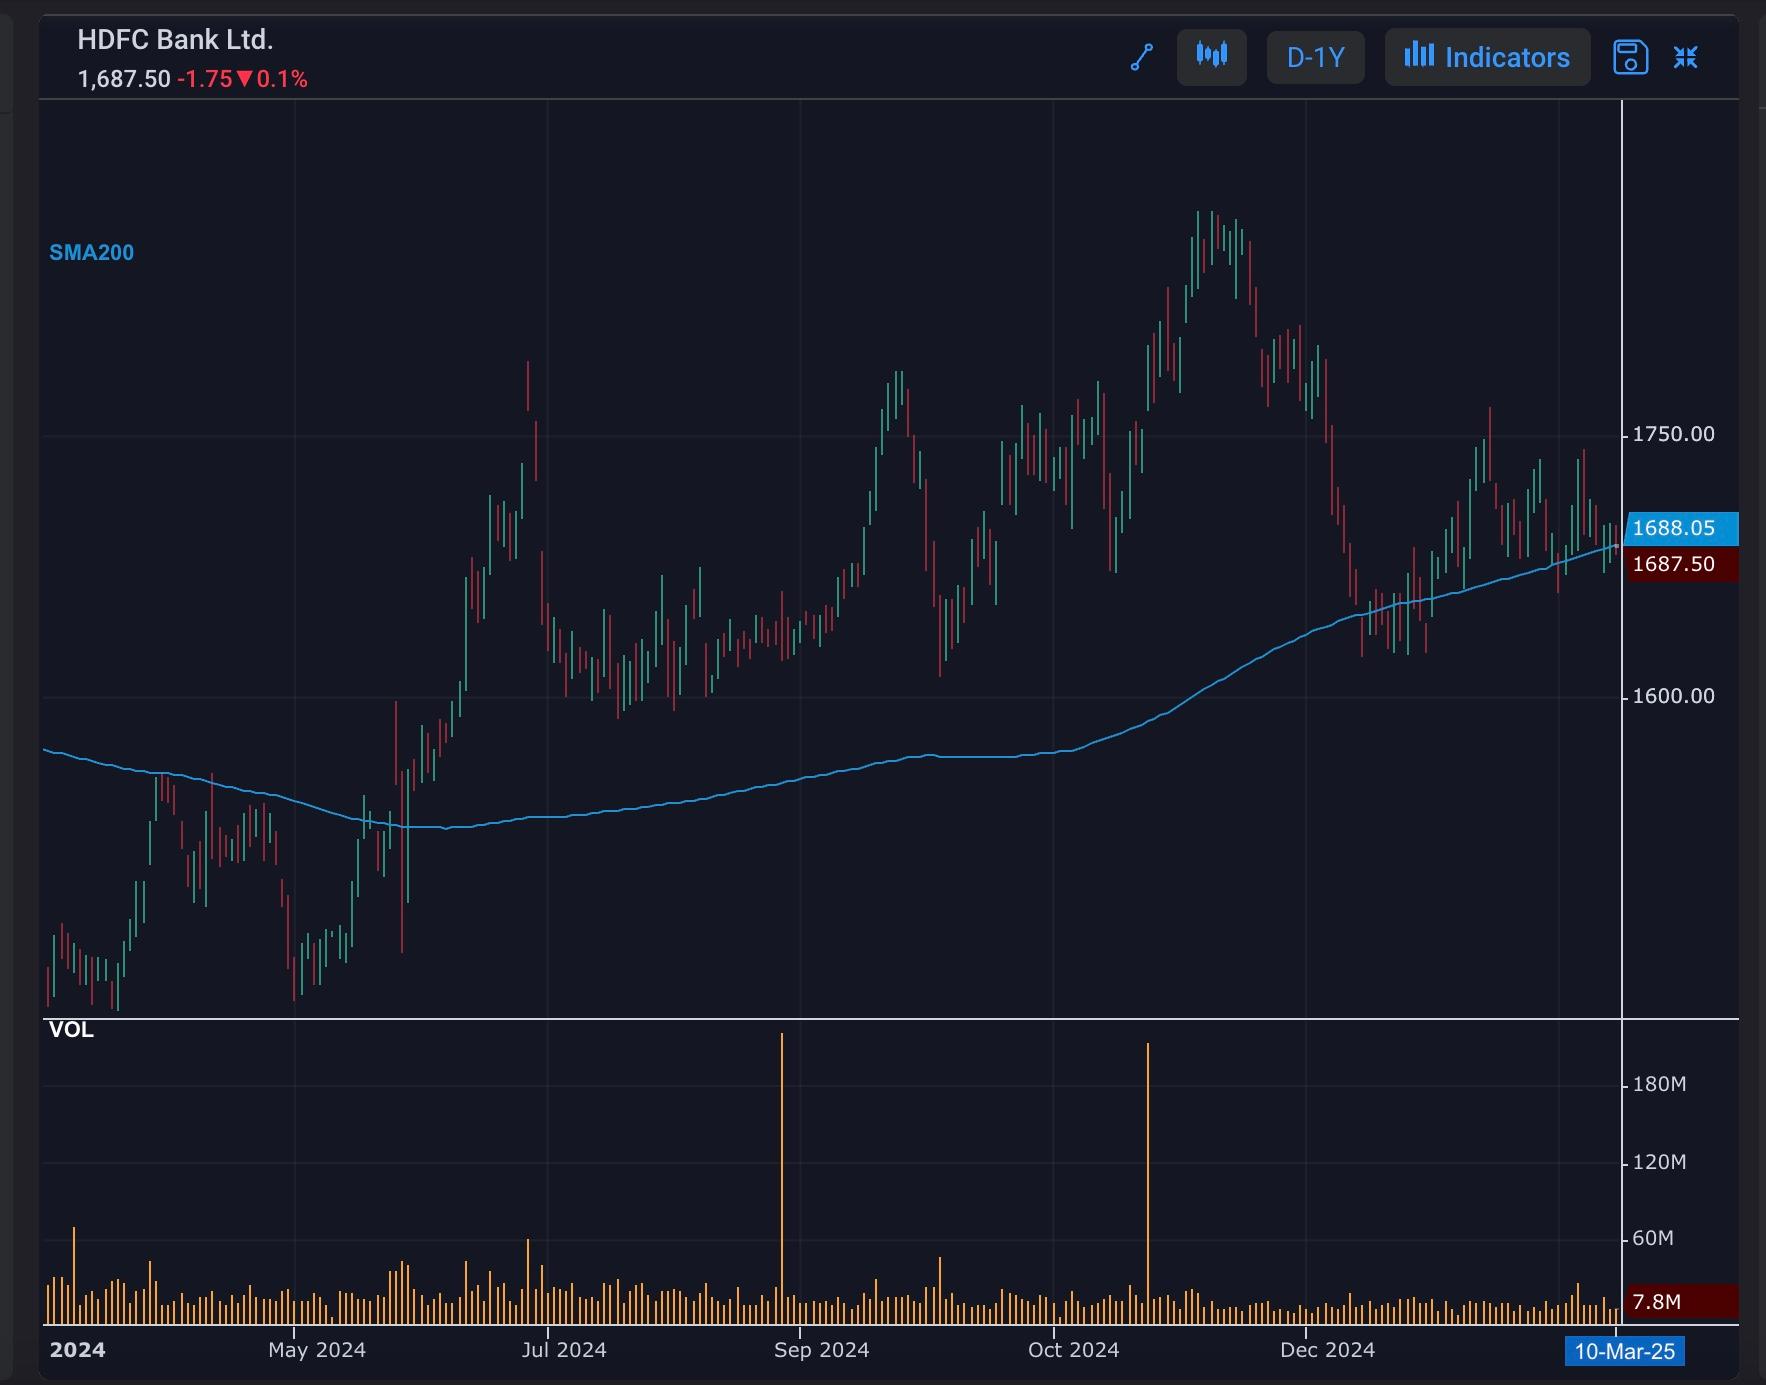
Key Level: Close Near 200-Day Simple Moving Average
HDFCBANK
The stock's close is hovering near the 200-day Simple Moving Average (SMA), a crucial technical level. The 200-day SMA serves as a long-term trend indicator, separating bullish and bearish trends.
A close near the 200-day SMA suggests that the stock is at a critical juncture. A breakout above this level could confirm a bullish trend reversal, while a breakdown below could indicate continued bearish pressure. Traders and investors should monitor the price action closely, as a decisive move away from the 200-day SMA could trigger significant price movement.
#WatchOutFor#TechnicalViews#EquityResearch
239 likes·72 comments