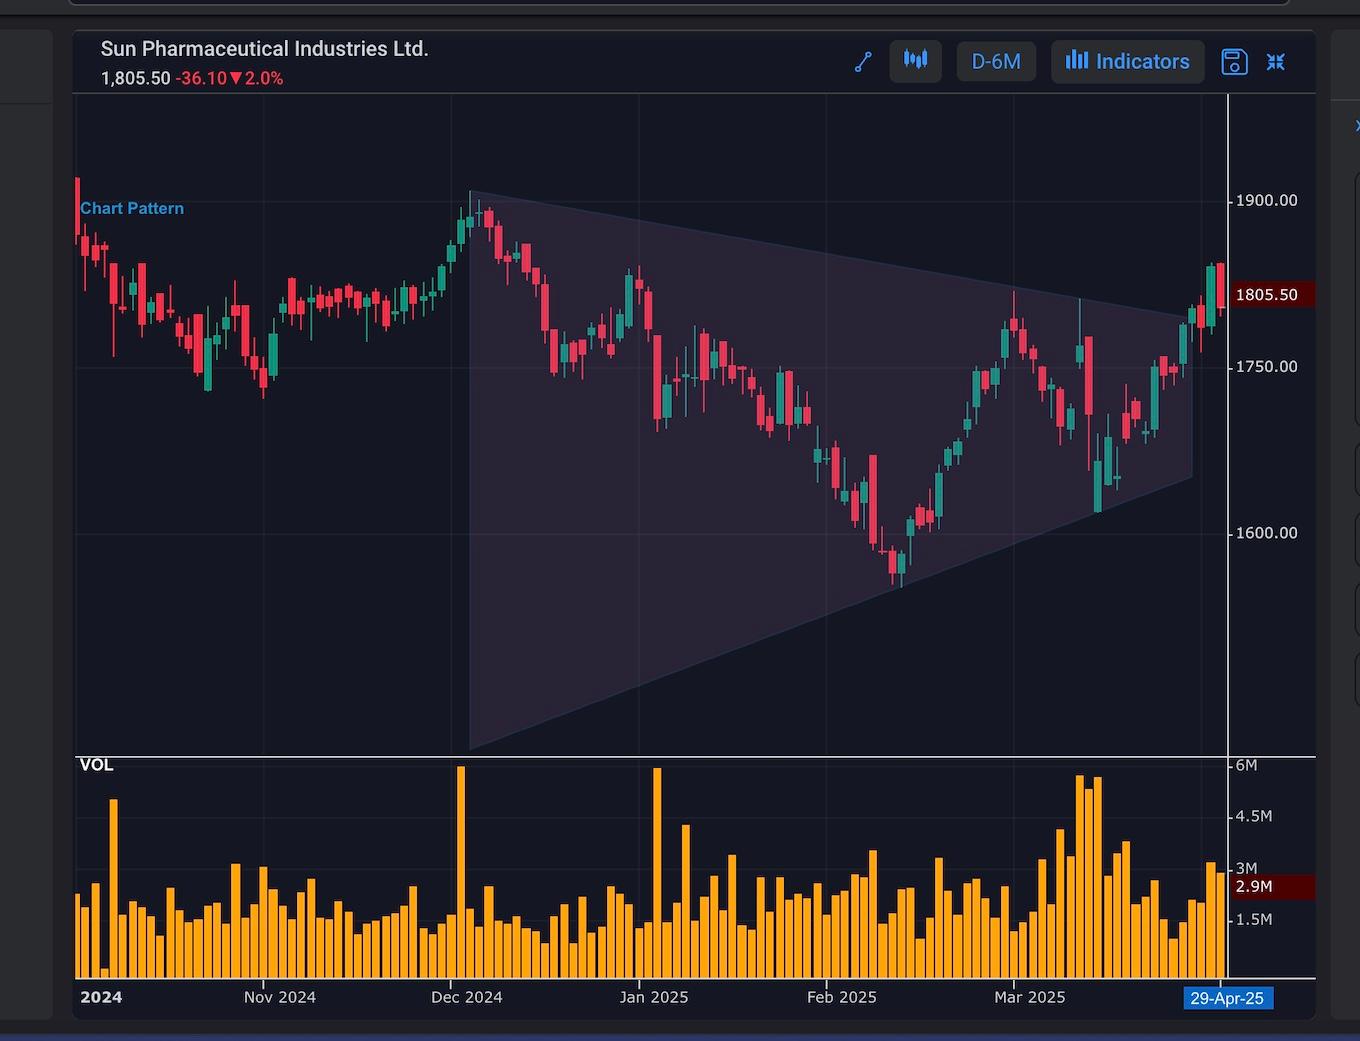
A symmetric triangle breakout occurs when a stock's price breaks out of a symmetrical triangle pattern, indicating a potential trend reversal or continuation.
Trading Opportunities:
- Buy Signal: An upward breakout can be a strong buy signal, indicating a potential trend reversal.
- Stop-Loss Adjustment: Traders may adjust their stop-loss levels to lock in profits as the stock breaks out.
- Further Growth: The stock may continue to rise, offering opportunities for traders and investors to capitalize on the upward trend.
How to Identify:
- Chart Pattern: Look for a symmetrical triangle pattern on a stock chart.
- Trend Lines: Draw trend lines connecting the highs and lows of the pattern.
- Breakout Point: Identify the breakout point where the stock price crosses the trend line.