



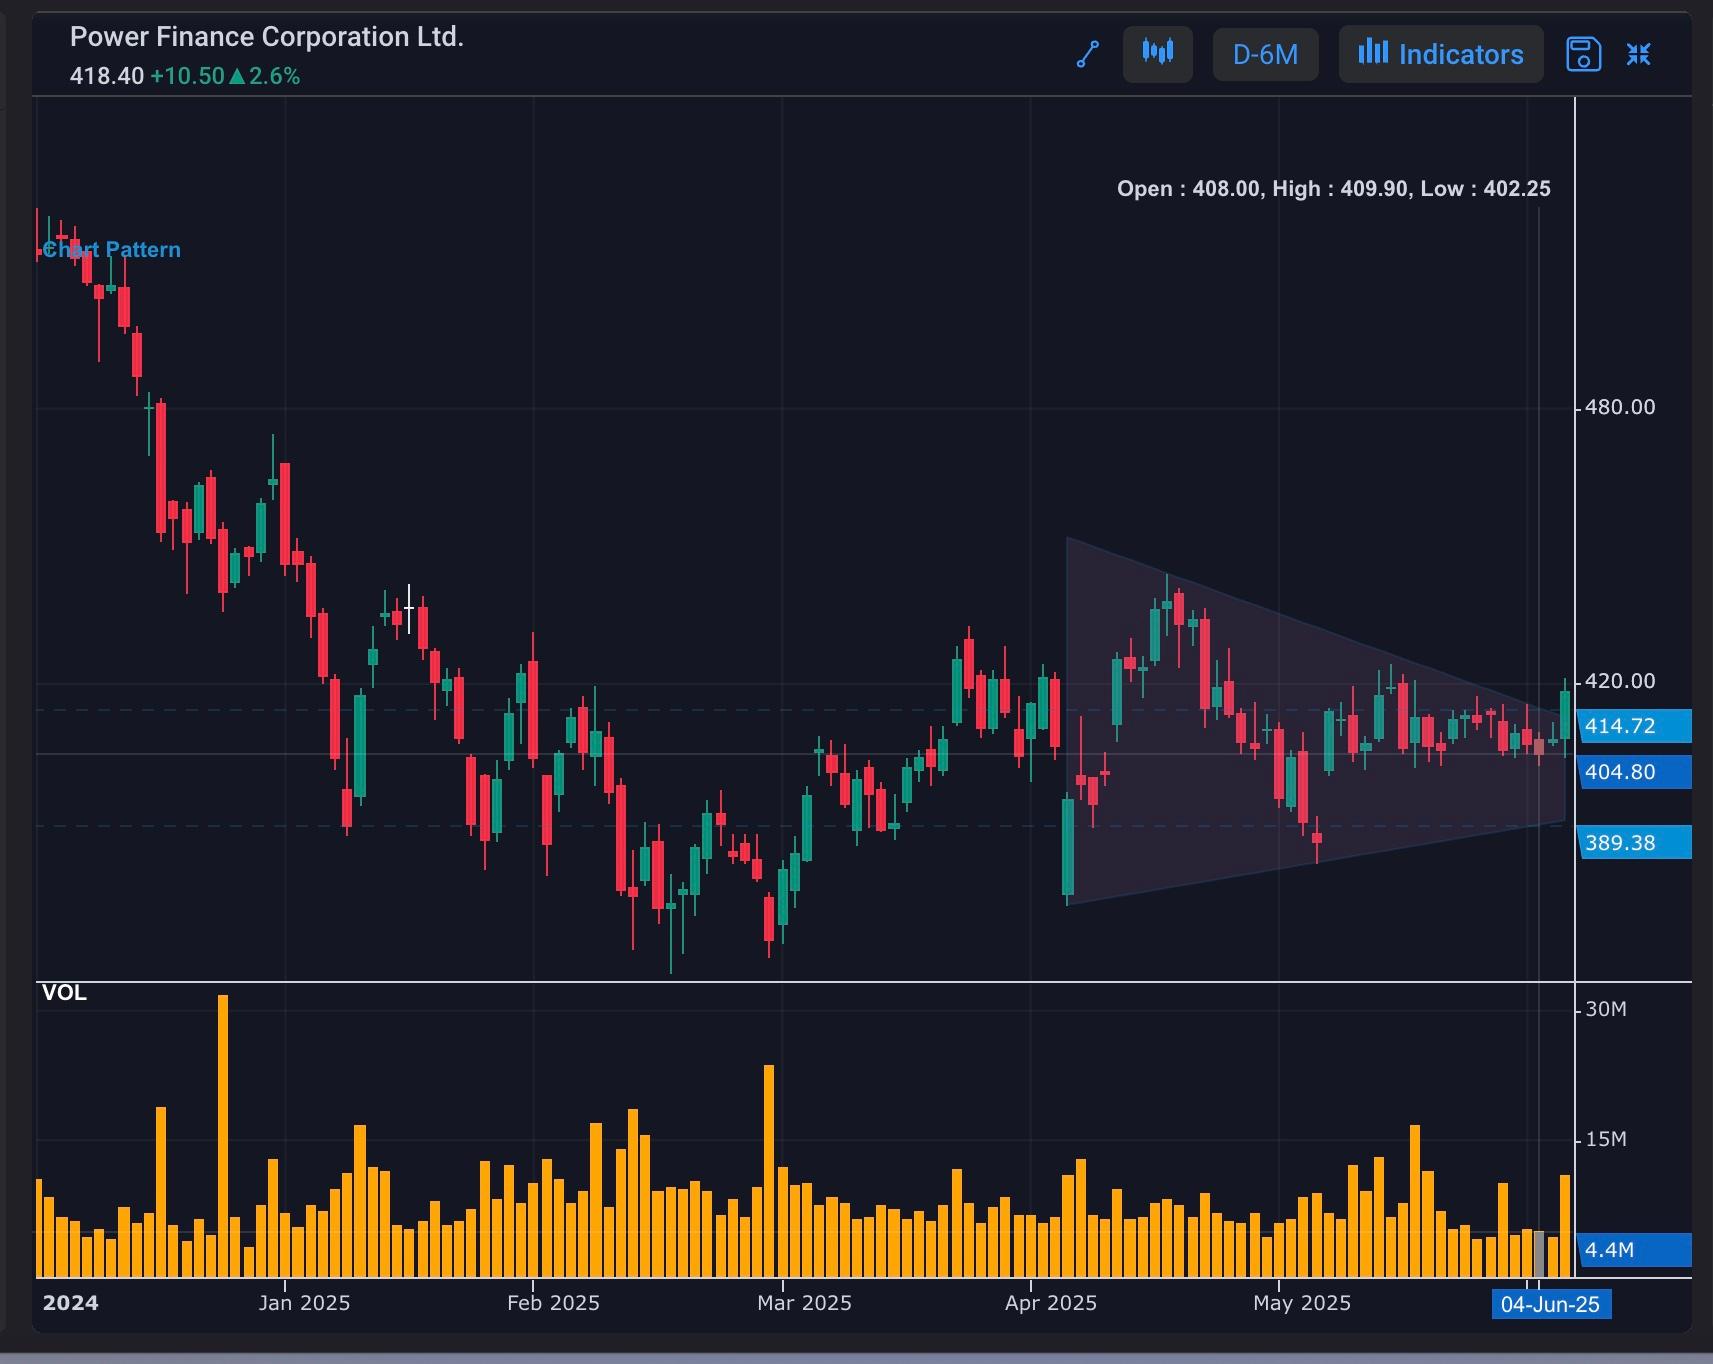
Symmetric Triangle: A Trading Pattern
PFC
A Symmetric Triangle is a chart pattern that forms when a stock's price action creates a series of higher lows and lower highs, converging into a single point. This pattern indicates a period of consolidation, where the stock's price is being squeezed into a tighter and tighter range. A Symmetric Triangle can be a continuation or reversal pattern, and its breakout can be a powerful trading signal. The pattern's symmetry and narrowing price range create a spring-like effect, making the eventual breakout a high-probability trading opportunity
#WatchOutFor#TechnicalViews
105 likes·56 comments