



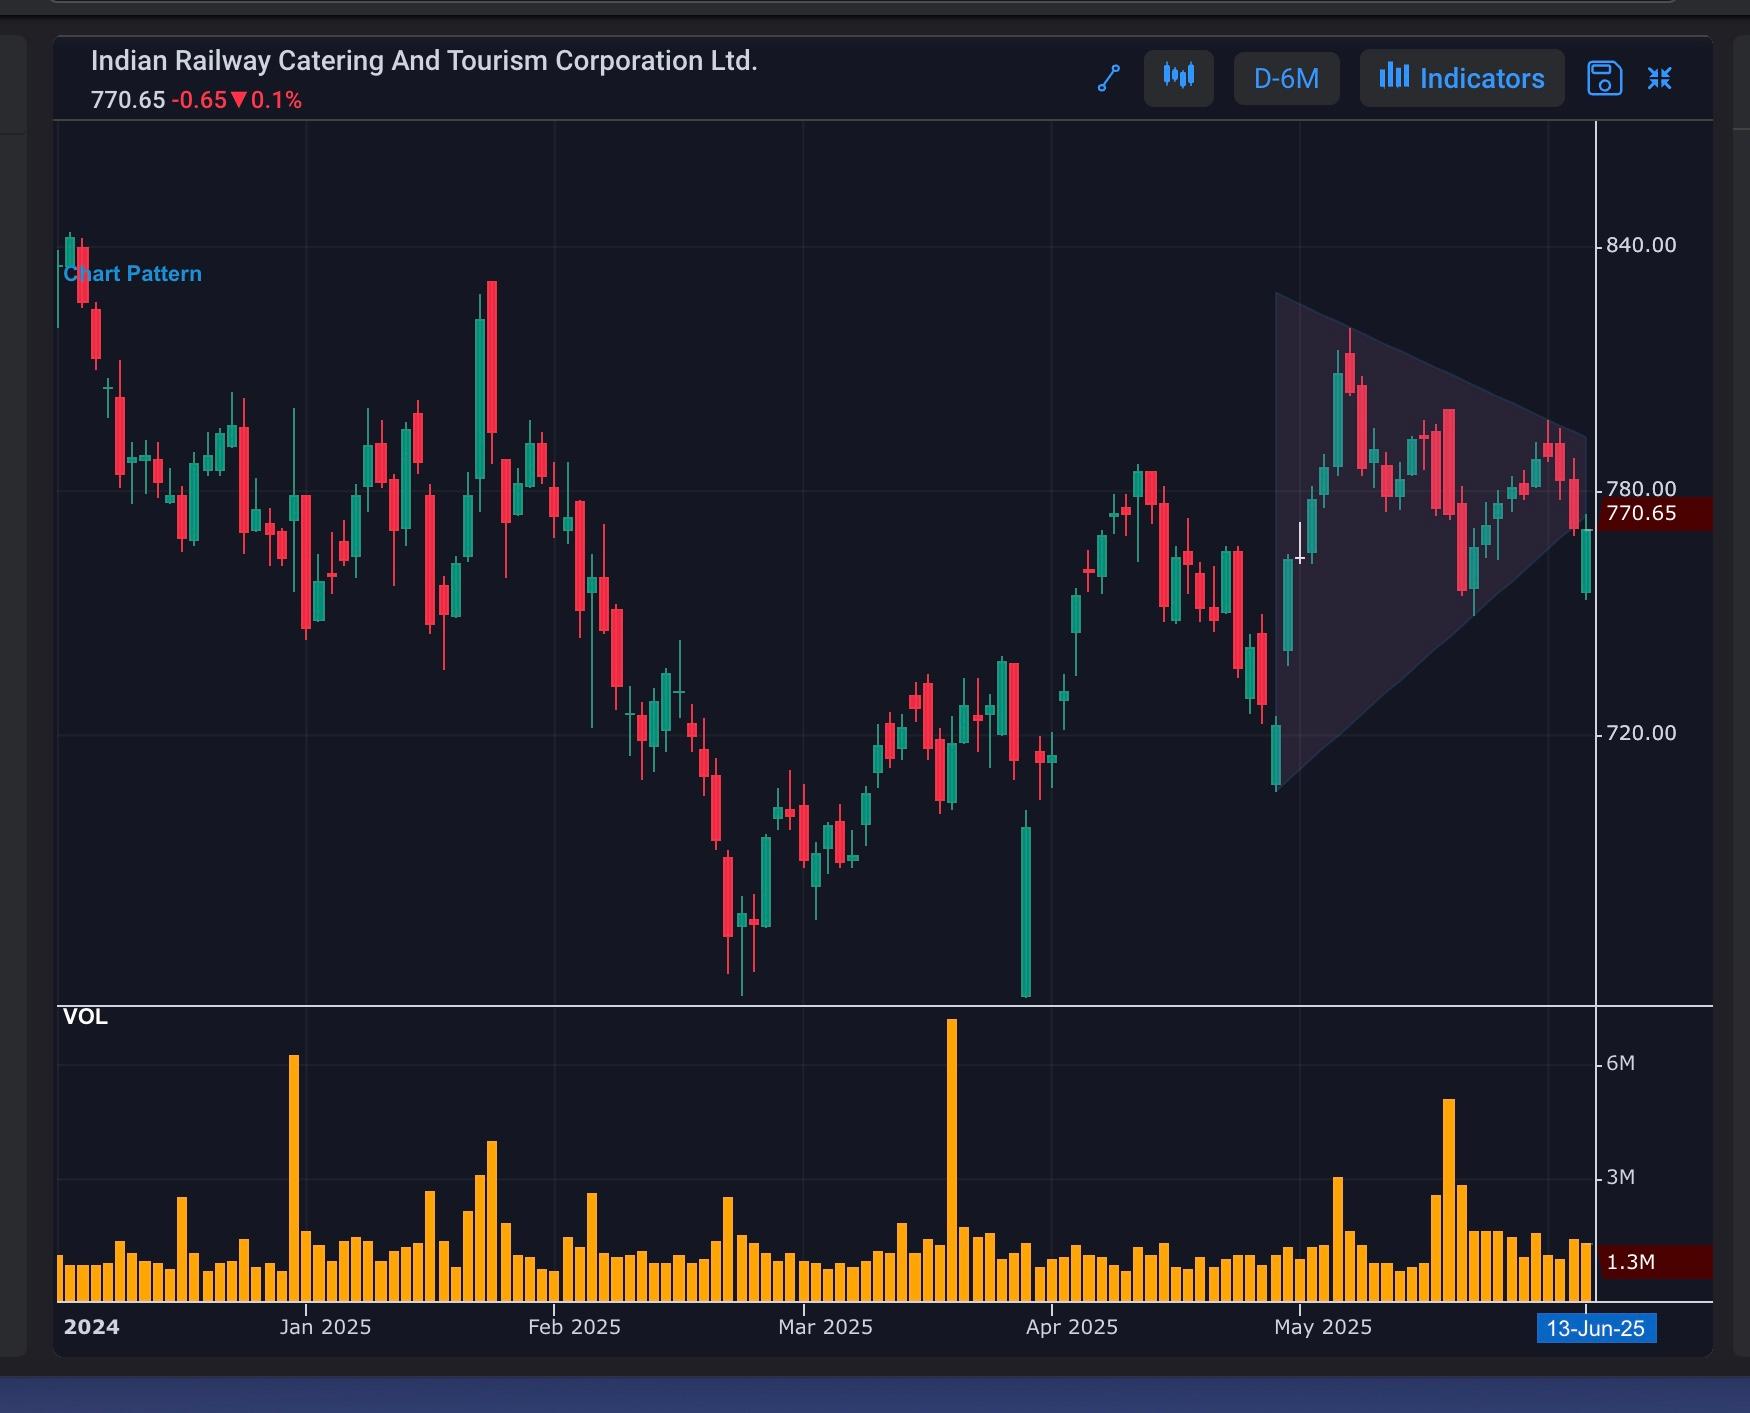
Symmetric Triangle Pattern: A Trading Opportunity
IRCTC
A Symmetric Triangle pattern has formed, indicating a potential trading opportunity. This chart pattern occurs when a stock's price consolidates within a narrowing range, forming a triangle shape. The Symmetric Triangle pattern suggests that the stock is preparing for a breakout, either upwards or downwards. Traders should watch for a close above the upper trendline or below the lower trendline to confirm the direction of the breakout. A successful breakout can lead to a significant price move, making this pattern a valuable trading opportunity
#TechnicalViews#WatchOutFor
211 likes·88 comments