



Symmetrical Triangle Pattern: A Balanced Battle Between Bulls and Bears!
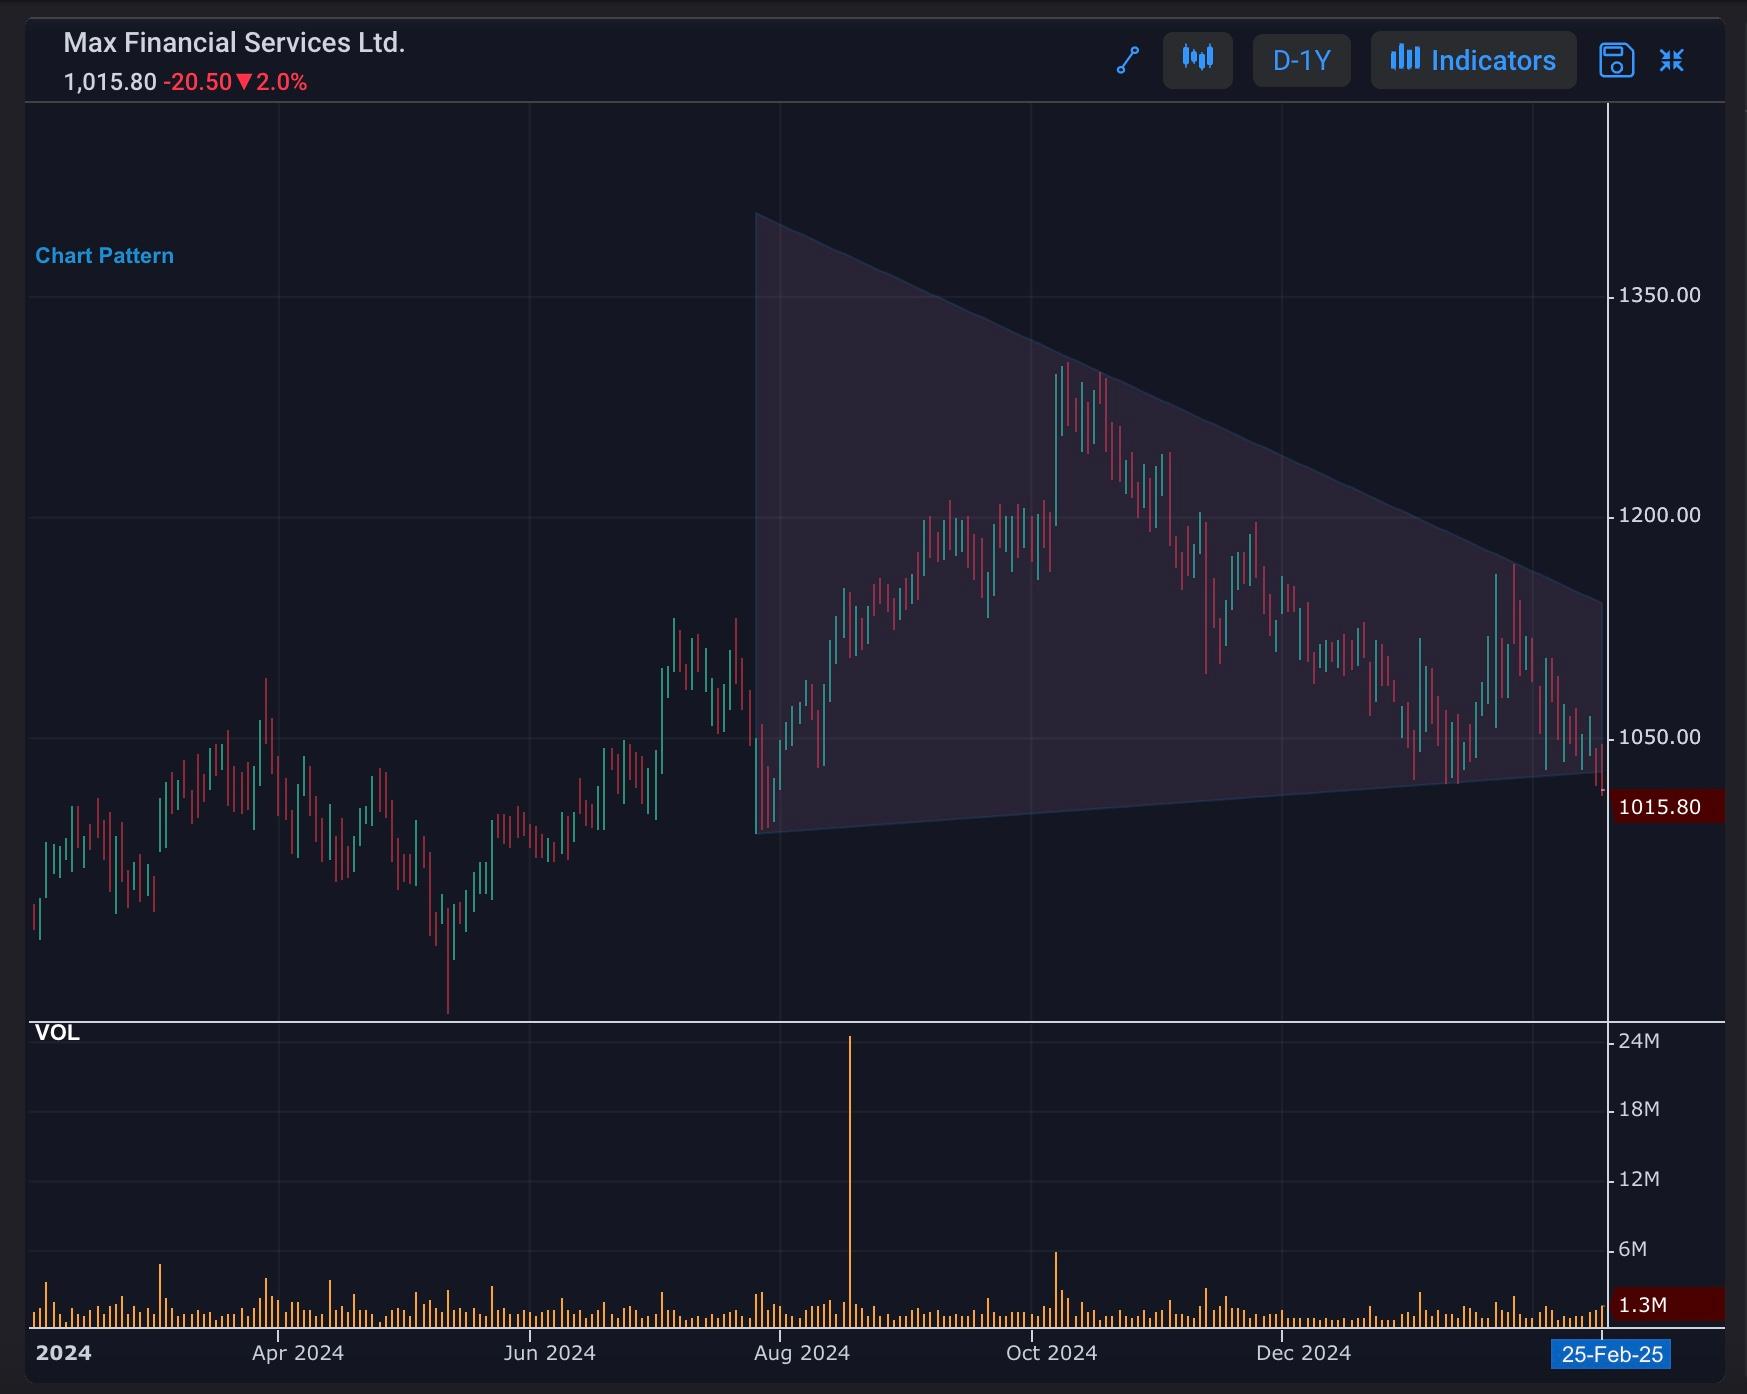
MFSL
A symmetrical triangle pattern has emerged, indicating a balanced struggle between buyers and sellers. This chart pattern is characterized by a series of higher lows and lower highs, with the stock price converging towards a apex.
Trading Implications
- Indecision among traders, with neither bulls nor bears in control
- Potential breakout in either direction
- Traders should watch for a decisive move above or below the triangle's boundaries
A symmetrical triangle pattern can be a powerful trading tool, as it often precedes a significant price movement. Traders should be prepared to adapt to changing market conditions and capitalize on the impending breakout.
#WatchOutFor#TechnicalViews#EquityResearch
285 likes·72 comments