‹ All Posts
AALGO BREATHS I SEBI RA

1 hour ago · SEBI Registration INH000019886

Zensar Technologies Ltd – Technical Market View
ZENSARTECH
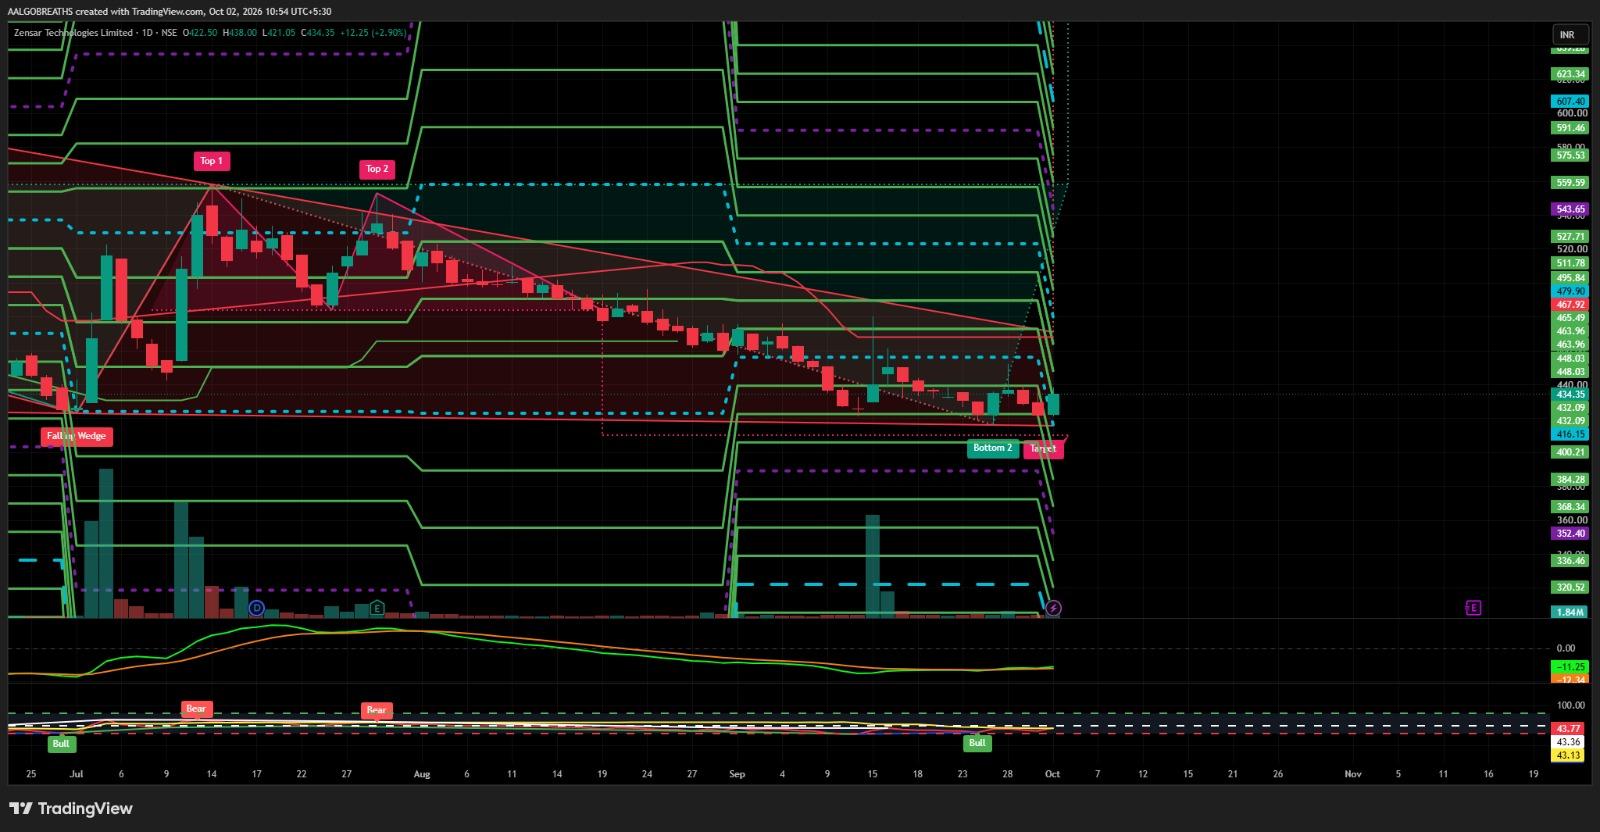
Zensar Technologies Ltd is currently showing a weak-to-neutral technical structure on the chart. The stock has been under pressure after forming a sequence of lower highs and gradually declining from the higher resistance zone. However, the recent price action near the ₹416–₹432 support area indicates that some buying interest may be emerging. The stock is currently trading around ₹434, and the ₹432–₹416 zone is an important support area to monitor. A sustained hold above this zone, followed by positive price action, could support a short-term recovery. The chart also indicates a possible bottom formation / falling-wedge type structure, but confirmation through price action and volume remains important. On the upside, the first resistance zone is around ₹448–₹463. A decisive move above this area could improve the short-term structure and bring ₹479–₹495 into focus. Further strength above ₹495 could open the way towards ₹511–₹528, followed by higher resistance levels around ₹544–₹560. On the downside, failure to hold ₹416 could increase selling pressure and expose the stock to lower support zones around ₹400, ₹384 and ₹368. Therefore, the reaction around ₹416–₹432 remains crucial. 🔹 Current Price: Around ₹434 🔹 Key Support: ₹432 | ₹416 | ₹400 | ₹384 🔹 Immediate Resistance: ₹448–₹463 🔹 Higher Resistance: ₹479–₹495 | ₹511–₹528 | ₹544–₹560 🔹 Short-Term Bias: Neutral to Cautious 🔹 Key Focus: Support holding, volume confirmation & breakout above resistance 📌 AALGO BREATHS SEBI Registered Research Analyst For educational and informational purposes only. This analysis is not a buy/sell recommendation. Securities-market investments are subject to market risks.

#WatchOutFor#FundamentalViews#TechnicalViews#EquityResearch#PersonalFinance
WhatsApp Image 2026-10-02 at 10.58.49 AM.jpeg
15 likes·14 comments