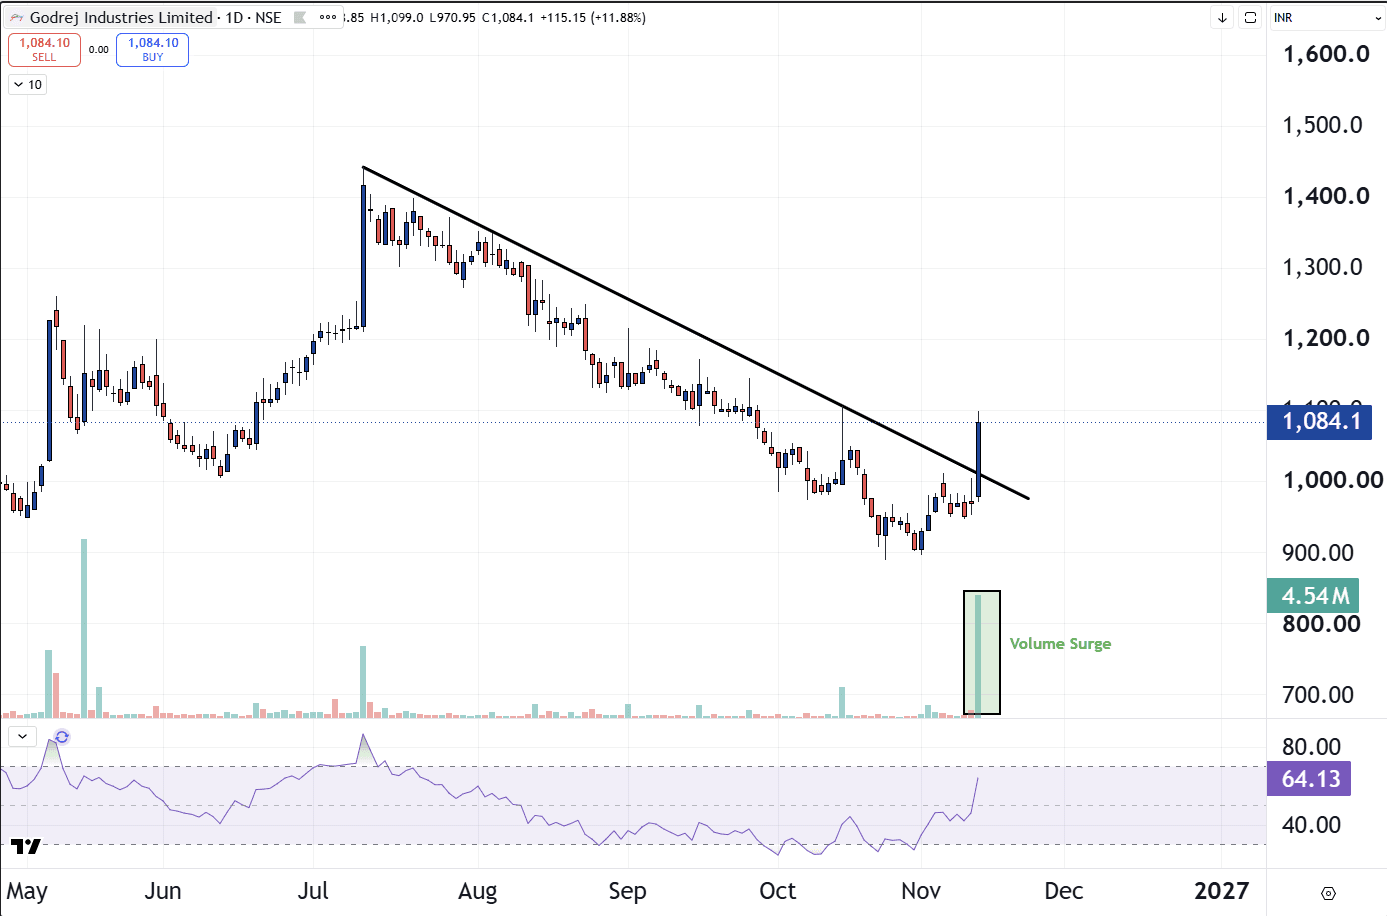
Godrej Industries Jumps 11.9%, breakout on daily chart
GODREJIND surged about 11.88% on 12 Nov, closing near Rs 1,084 on a day. Its financial services arm, Godrej Capital, secured a Rs 2,500 crore investment from Temasek, as per CNBC-TV18. The investment comes through Temasek’s affiliate Jongsong Investments at a valuation of up to Rs 28,000 crore. The Godrej Industries Group will retain about 80% ownership, and the deal is subject to regulatory approvals. Godrej Capital had AUM of Rs 35,000 crore as of 31 October 2026 and is targeting Rs 1 lakh crore by 2031. Source: CNBC-TV18 news Technically, the daily chart shows a breakout above the falling trendline that had capped the stock since the July high, with a long bullish candle and a visible volume surge. RSI is near 64. The earlier swing high near 1,100 is the nearest resistance on the chart, and the broken trendline zone near 1,000 to 1,010 is the level to watch on the downside. After a sharp one-day move, a retest or consolidation would not be unusual. Whether the stock holds above the trendline with healthy volume is worth observing. A fundamental trigger with a trendline breakout and a volume surge adds weight to a move, but holding above the broken trendline decides whether it lasts. Disclaimer: This is for educational purposes only and is not investment advice. Please consult your financial advisor before making any investment decisions. SEBI Registered Research Analyst — INH000025212.