55 mins ago · SEBI Registration INH000019309
SEBI Registration INH000019309 · 55 mins ago
Axis Bank: Trendline Break, But Hope Remains
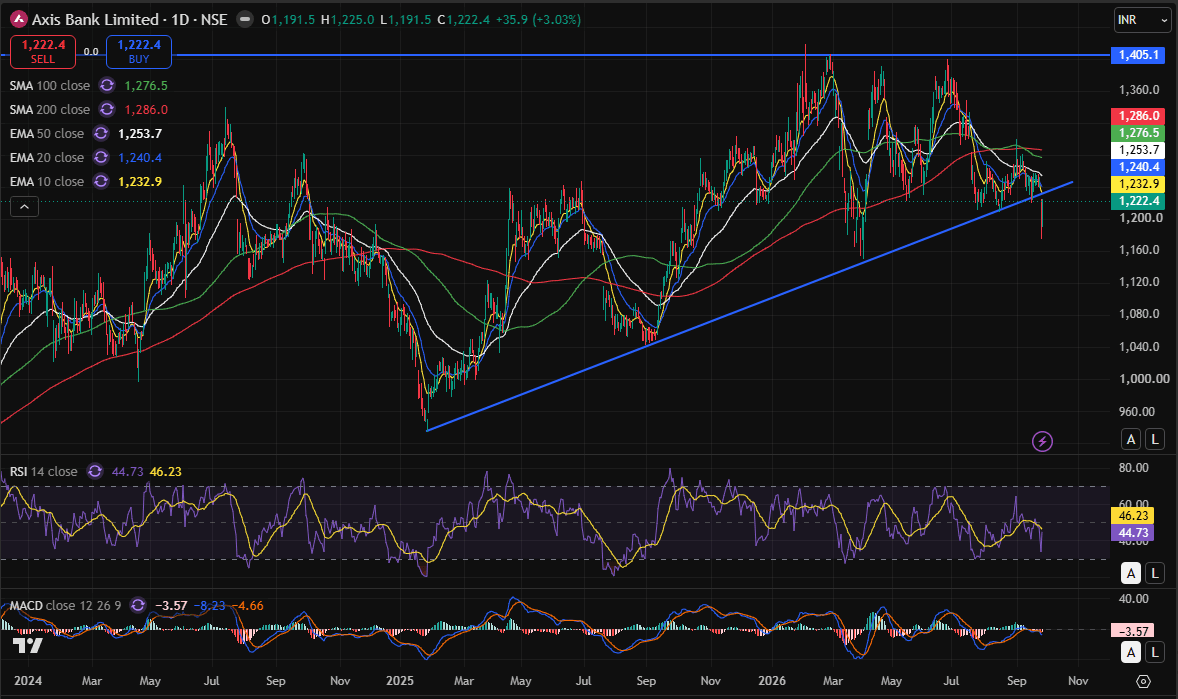
Axis Bank has broken below its rising trendline and slipped to ₹1,175 before recovering towards ₹1,222. The ₹1,150–₹1,180 zone is now the key support area.
The stock was earlier respecting its long-term rising trendline, but the recent breakdown has weakened the near-term structure. More importantly, Axis Bank is currently trading below its 50 EMA, 100 SMA and 200 SMA, which indicates that short-term momentum has turned cautious.
However, the chart is not yet giving a clear breakdown confirmation. The stock has taken support around the April 2026 swing-low zone of ₹1,150–₹1,180 and bounced from there.
RSI is at 44.73, which means the stock is weak but not oversold. This leaves room for another recovery attempt if buyers become active around the ₹1,150–₹1,180 support zone.
MACD is also in negative territory and the histogram is showing weakness. However, the MACD line is still hovering close to the zero line rather than showing a deep negative trend. So, the momentum is weak, but a larger bearish move is not yet confirmed.
For me, ₹1,150 is the level to watch closely. If Axis Bank sustains above this zone on a closing basis, the recent fall could turn out to be a correction rather than a major trend reversal.
On the upside, ₹1,250 is the first important level. A sustained move above ₹1,250 can improve the chart structure, while a move above ₹1,300 would strengthen the possibility of the stock attempting its previous highs again.
So, the rising trendline has definitely broken, but the ₹1,150–₹1,180 support zone is still keeping the recovery possibility alive. The next few sessions around this zone will be important.
My View: Wait for price confirmation rather than assuming either a complete breakdown or an immediate reversal.
Disclosure: I or my family do not have any position in Axis Bank.