28 mins ago · SEBI Registration INH000019309
SEBI Registration INH000019309 · 28 mins ago
Britannia Industries: Trendline Support Under Pressure
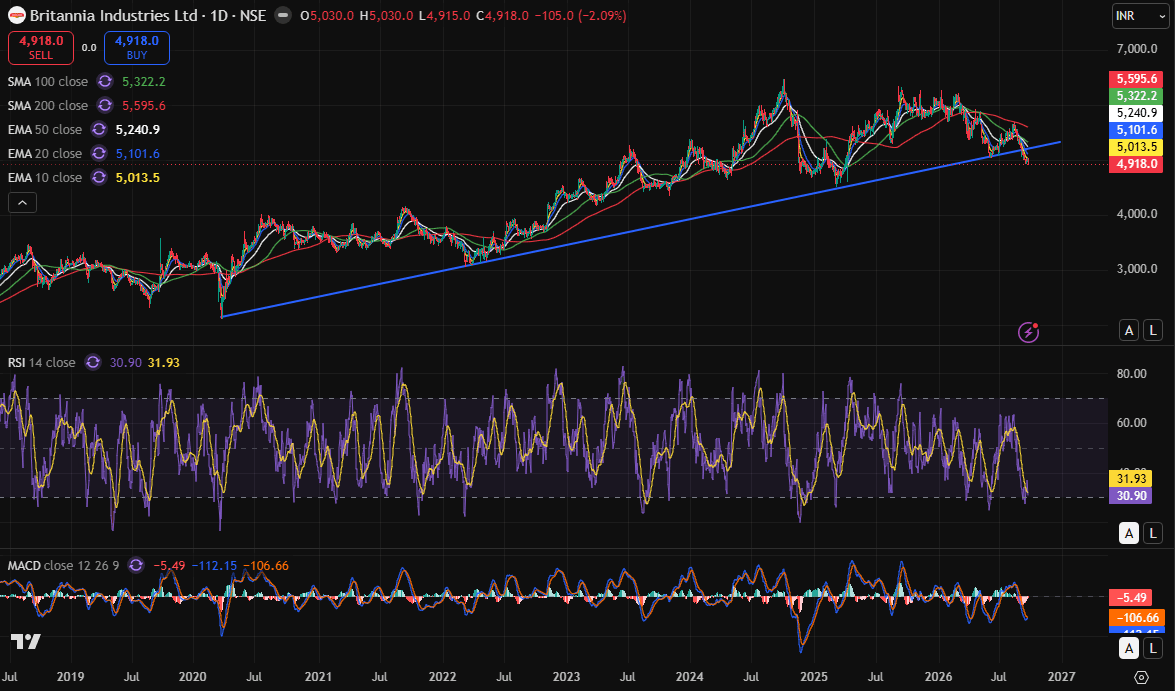
Britannia Industries closed at ₹4,918, down 2.09%, breaking below the rising trendline visible on the daily chart.
The technical setup has turned weak as the stock is trading below its 10 EMA (₹5,013), 20 EMA (₹5,102), 50 EMA (₹5,241), 100 SMA (₹5,322) and 200 SMA (₹5,596).
The key concern is the breakdown of the long-term rising trendline, which had supported the stock during previous corrections. A sustained move below this zone could keep selling pressure active.
RSI is around 31, indicating that the stock is approaching the oversold zone. However, oversold conditions alone do not confirm a reversal, particularly when the broader trend remains weak.
MACD is also in negative territory, supporting the current bearish momentum.
From a technical perspective, ₹5,000–₹5,015 is an immediate resistance zone, while the recent breakdown area and trendline will be important for any recovery attempt. A move back above the short-term moving averages would be required to improve the setup.
My View: The chart currently indicates caution. Traders should watch whether Britannia Industries sustains below the trendline or manages to reclaim the ₹5,000–₹5,015 zone.
Disclosure: I have no financial interest in Britannia Industries. This is for educational purposes only.