3 hours ago · SEBI Registration INH000019309
SEBI Registration INH000019309 · 3 hours ago
Oil & Natural Gas Corporation: Support Zone Signals Recovery
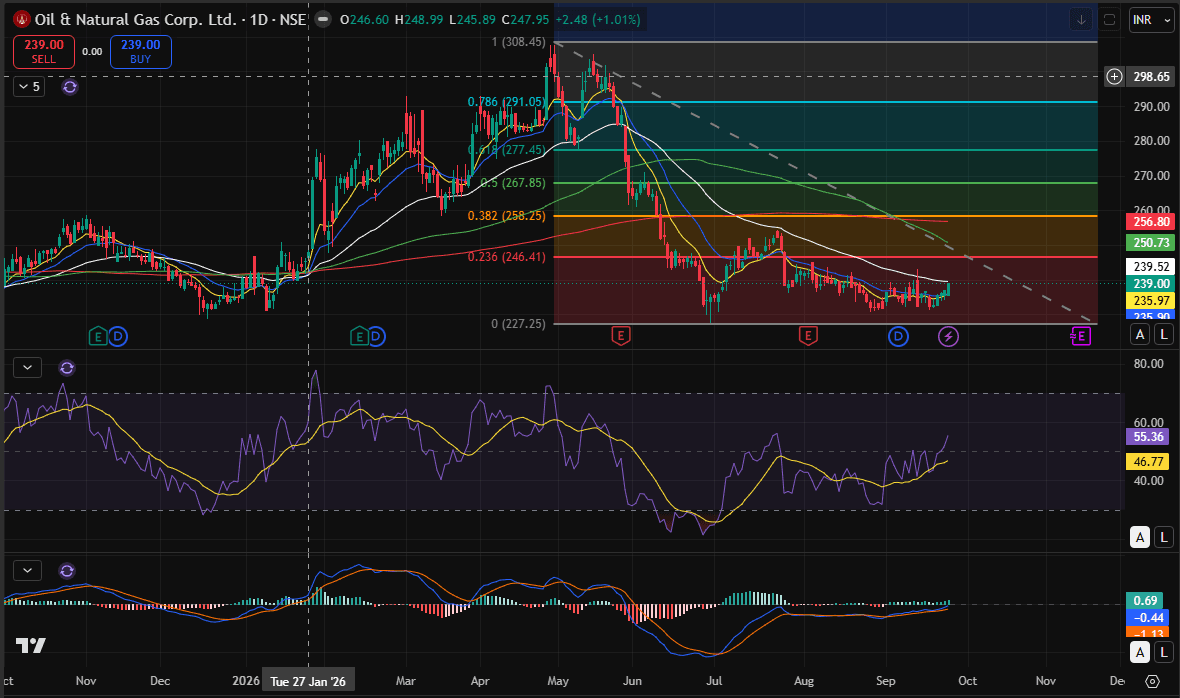
Oil & Natural Gas Corporation has undergone a correction of nearly 25% from its recent high and is now showing signs of stabilization near an important support zone. The recent price action suggests that selling pressure has started to ease, with the stock attempting to form a base.
On the Fibonacci retracement structure, ₹246.50 is an important near-term trigger. A sustained breakout above this level can strengthen the setup and open the way towards ₹258, which also coincides with the 38.2% retracement zone. A decisive move above ₹258 could further improve the chart structure and bring ₹268 into focus.
Momentum indicators are also showing improvement. RSI is around 55.36 and has moved above its signal/average near 46.77, indicating improving buying momentum without entering an overbought zone. The MACD histogram has turned positive at around 0.69, while the MACD line is still below the zero line, suggesting that momentum is improving but confirmation of a stronger trend is still required.
The stock is currently trading above the short-term moving-average cluster visible on the chart, which supports the possibility of a recovery. However, higher moving averages and the ₹258–₹268 region remain important hurdles.
Overall, ₹246.50 is the key level to watch. A sustained breakout can provide confirmation of a short-term trend reversal, while failure to cross this zone may keep the stock in a consolidation phase.
Key Levels: ₹246.50 breakout | ₹258 first target zone | ₹268 next resistance
Support: ₹236–₹240 zone
Disclosure: I am a SEBI Registered Research Analyst. I do not have any financial interest in the security discussed. This article is for informational purposes only and should not be considered a recommendation to buy or sell.