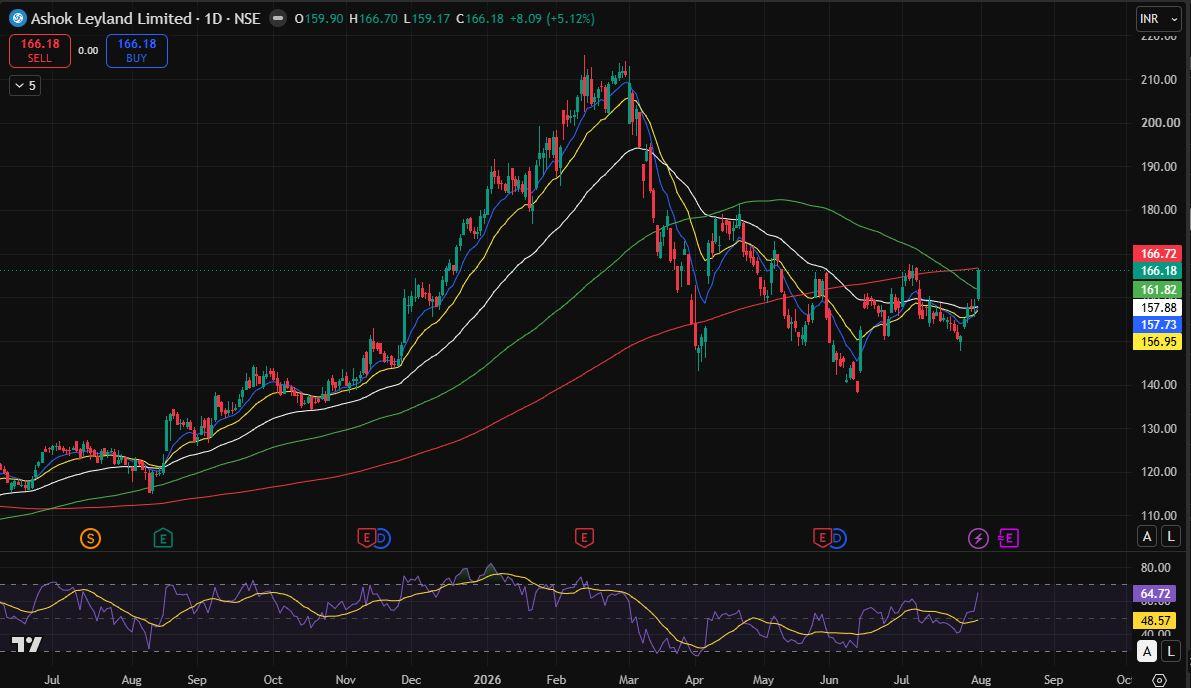
Ashok Leyland – Technical Outlook
Ashok Leyland is on the verge of a significant technical breakout after forming an Inverted Head & Shoulders pattern on the daily chart. The neckline is placed around ₹167.50–168, which also aligns closely with the 200 SMA (₹166.72), making this zone a major resistance. A decisive close above this level would not only confirm the reversal pattern but also indicate a breakout above the long-term moving average, strengthening the bullish outlook. The stock has already reclaimed the 10 EMA (₹157.73), 20 EMA (₹156.95), and 50 EMA (₹157.88), reflecting strong short-term momentum. The 100 SMA at ₹161.82 has also been crossed convincingly, indicating that buyers have regained control after months of consolidation. The RSI has climbed above 65, showing improving momentum with a positive crossover. Price action has started forming higher highs and higher lows, while the right shoulder of the pattern suggests steady accumulation. Key Levels Major Breakout Zone: ₹167.50–168 (Neckline + 200 SMA) Immediate Support: ₹161–162 (100 SMA) Strong Support: ₹157–158 (10/20/50 EMA cluster) Upside Targets Target 1: ₹175 Target 2: ₹182 Target 3: ₹190–195 (Inverted Head & Shoulders projection) Risk A failure to sustain above ₹168 may keep the stock in consolidation. A daily close below ₹157 would weaken the short-term bullish momentum, while a close below ₹156 would invalidate the current breakout structure. Outlook $ASHOKLEY is approaching a high-conviction breakout zone where the Inverted Head & Shoulders neckline and the 200 SMA converge around ₹167.50–168. A strong close above this resistance, supported by higher volumes, could trigger fresh buying interest and pave the way for a rally towards ₹175–195 over the next 6–10 weeks. Until then, the ₹167.50–168 zone remains the most critical level to monitor.