6 hours ago · SEBI Registration INH000019309
SEBI Registration INH000019309 · 6 hours ago
Hindustan Unilever: What the Weekly Chart Indicates
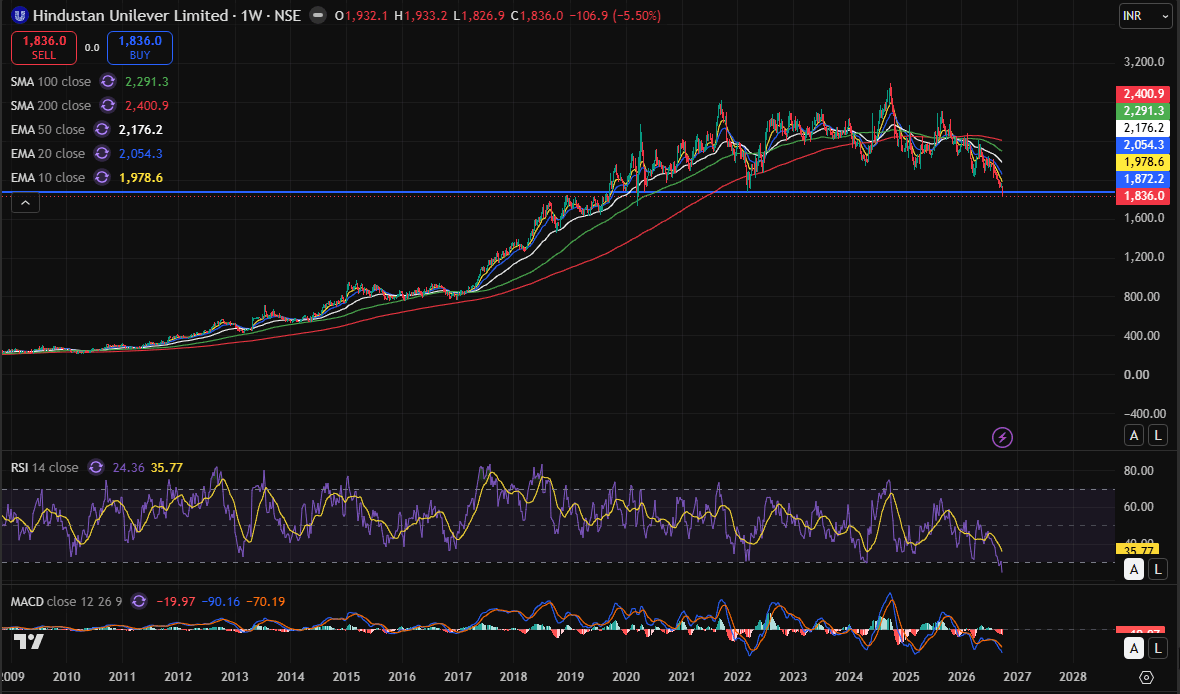
Hindustan Unilever Limited is showing a clear deterioration in its long-term technical structure, with the weekly chart now pointing towards a possible trend change.
The stock closed around ₹1,836, falling 5.5% in the latest weekly session. More importantly, price is trading below the 10, 20, 50, 100 and 200-week moving averages, indicating broad-based weakness rather than a normal short-term correction.
The momentum indicators are also weak. RSI is around 24, placing the stock in the oversold zone, while MACD remains negative and is pointing downward. This shows that selling pressure is still dominant.
What happens next?
The ₹1,800–1,830 zone becomes an important support area. A sustained hold here could lead to some consolidation or an oversold bounce. However, oversold RSI alone should not be treated as a reversal signal.
On the upside, ₹1,900–1,920 is the first important recovery zone. A decisive weekly close above this area would be an early indication that selling pressure is easing. Above that, the ₹1,975–2,050 zone becomes important because it contains the 10-week and 20-week averages shown on the chart.
On the downside, a decisive break below ₹1,800 could open the door towards the next support near ₹1,760.
My view: HUL is currently in a weak technical phase. Rather than assuming that oversold conditions mean an immediate reversal, traders should watch how price behaves around ₹1,800 and whether it can reclaim ₹1,900–1,920 with strength.
Disclosure: This is an educational/technical view and not investment advice. Investors should consider their own risk profile and conduct independent research.