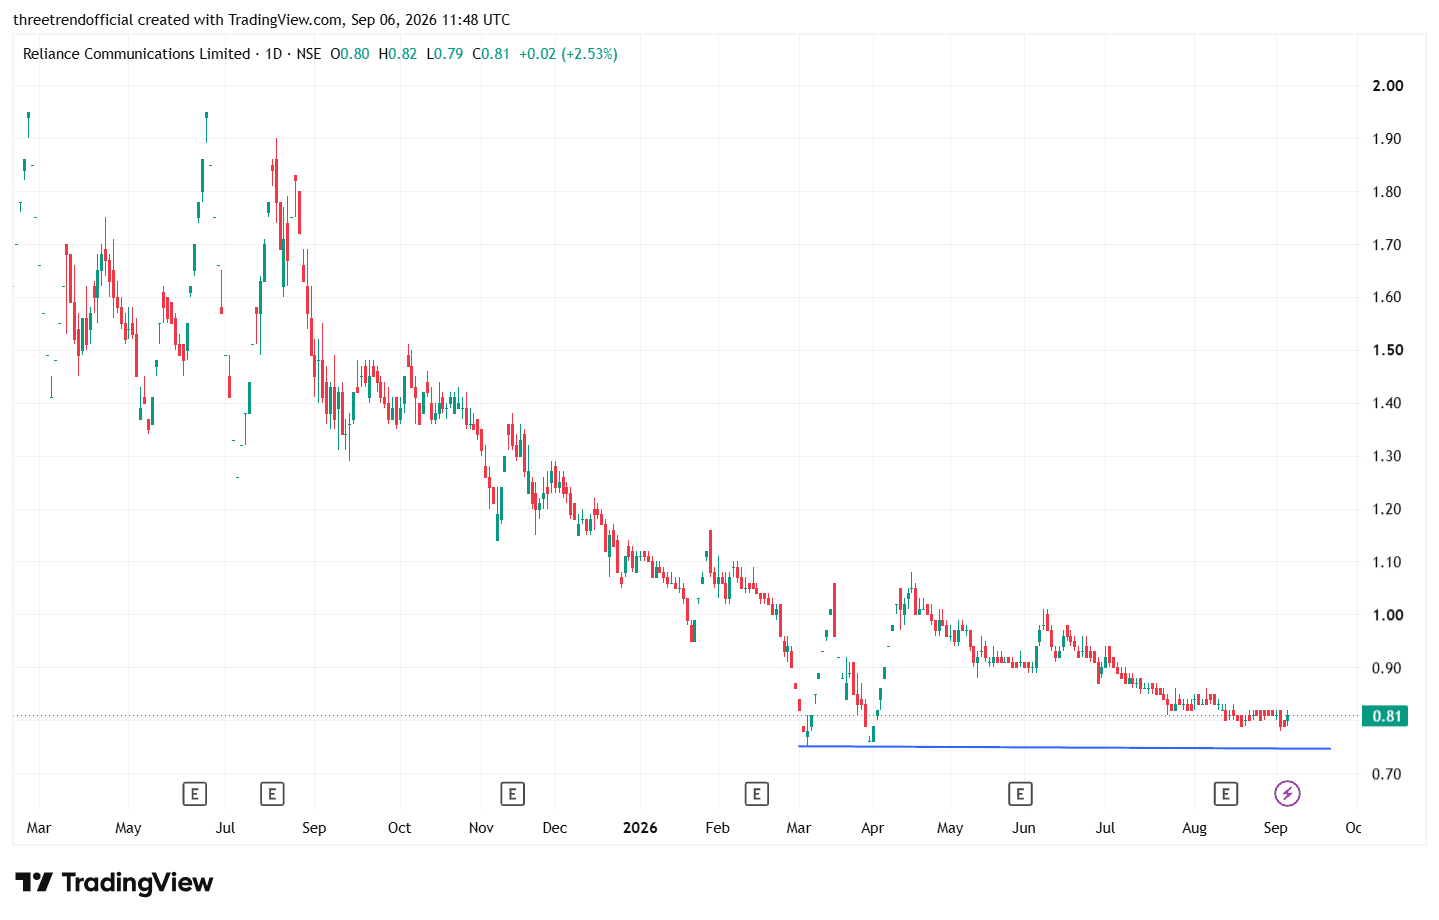
Horizontal Trendline Support Zone chart details

Popular topics to explore
Horizontal Trendline Support Zone chart details

Inverted head and shoulder
Markets Await Reliance, HDFC Bank & ICICI Bank Results, Heavyweight Earnings To Drive Direction 📊🏦
Indian markets opened cautiously as investors shifted their focus to the Q1 FY27 earnings of heavyweight companies including Reliance Industries, HDFC Bank, and ICICI Bank. These companies have a significant weight in benchmark indices, and…
“Why Volatility Is an Opportunity, Not an Obstacle”
Volatility is often viewed as risk, but it also creates opportunity. Professional traders adapt by: Reducing position size when volatility rises Waiting for confirmation instead of reacting Focusing on high-quality setups Learning: Volat…
PART 2 : How Ratio Analysis Helps Investors ?
In this series we are covering stock
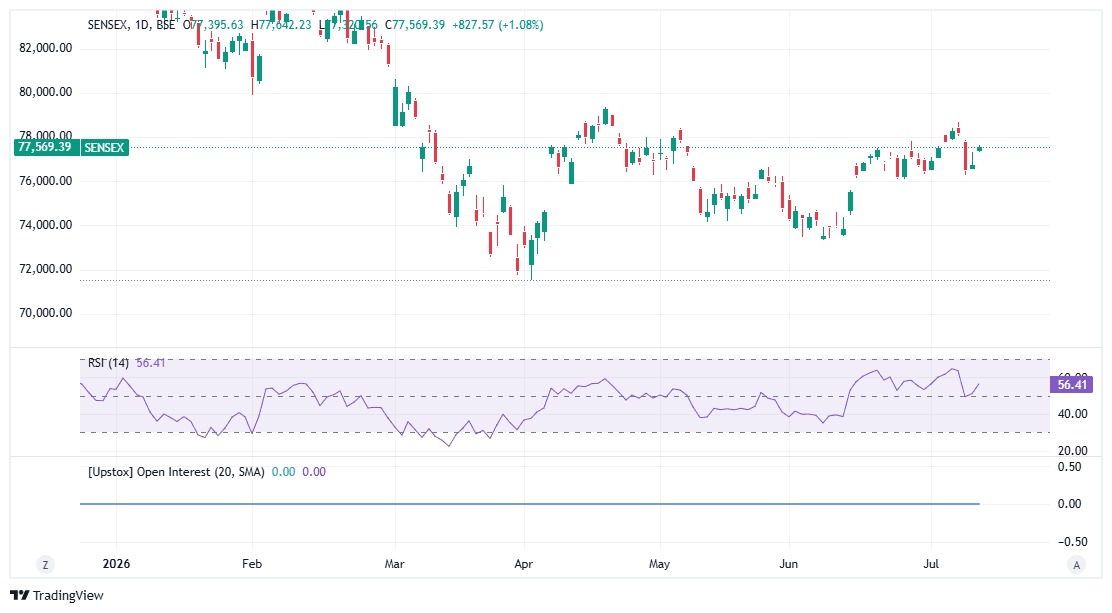
Sensex : 77569.39
Sensex index may trade Sell on rise and Buy on dip ( Both sided) considering Broader level of sensex
Support : 76800-76250 - 75800
Resisatence : 77700, 77920, 78180

Today's Fall Reminded Me of Something...
Every correction convinces people that this time it's different. People stop SIPs, sell in panic, or keep waiting for even lower prices. The truth is, nobody knows where the bottom is. The market may fall further, or it may recover sooner…
Why Vodafone Idea Stock Jumped 7% — What a Confidence Capital Infusion Means for Investors
Vodafone Idea shares surged 7.32% to ₹12.76 on NSE on Wednesday after reports suggested the company may receive a fresh round of capital infusion led by newly appointed non-executive chairman Kumar Mangalam Birla. Confidence capital is not…
Reliance Board Approves FY26 Results: PAT ₹95,610Cr, Analyst Meet Transcript Released
📉 Reliance Q4: Profit Falls Despite Revenue Growth
Daily Index View : SENSEX as on 13/04/2026
1. Market Trend PROBABILITY 🚨 Current Market Trend: Positive 🚀 25% 🔍 Key Level to Watch: 76239 🔄 Current Market Surface: The trend will stay Positive until the market stay above 76239 That’s 1311 points away from the last d…
“Why Price Behavior Near Key Levels Is Critical”
Key levels attract strong buying or selling interest.
What to observe at these levels:
Speed of reaction
Volume changes
Whether price holds or rejects
Learning:
The level itself is not important —
the reaction to it is.
Daily Index View : SENSEX as on 13/03/2026
🎯 Market Surface : Intraday Prospective 🚨 Current Market Trend: Negative 📉 - Probability -10% 🔍 Key Level to Watch: 77079 🔄 Current Market Surface: The trend will stay negative until the market stay below 77079 That’s…
“Why Strong Trends Resist Deep Corrections”
In a strong trend, corrections are usually shallow and brief. Signs of a strong trend: Higher lows forming consistently Quick recovery after pullbacks Buyers entering earlier at each dip Learning: Deep corrections often signal weakenin…
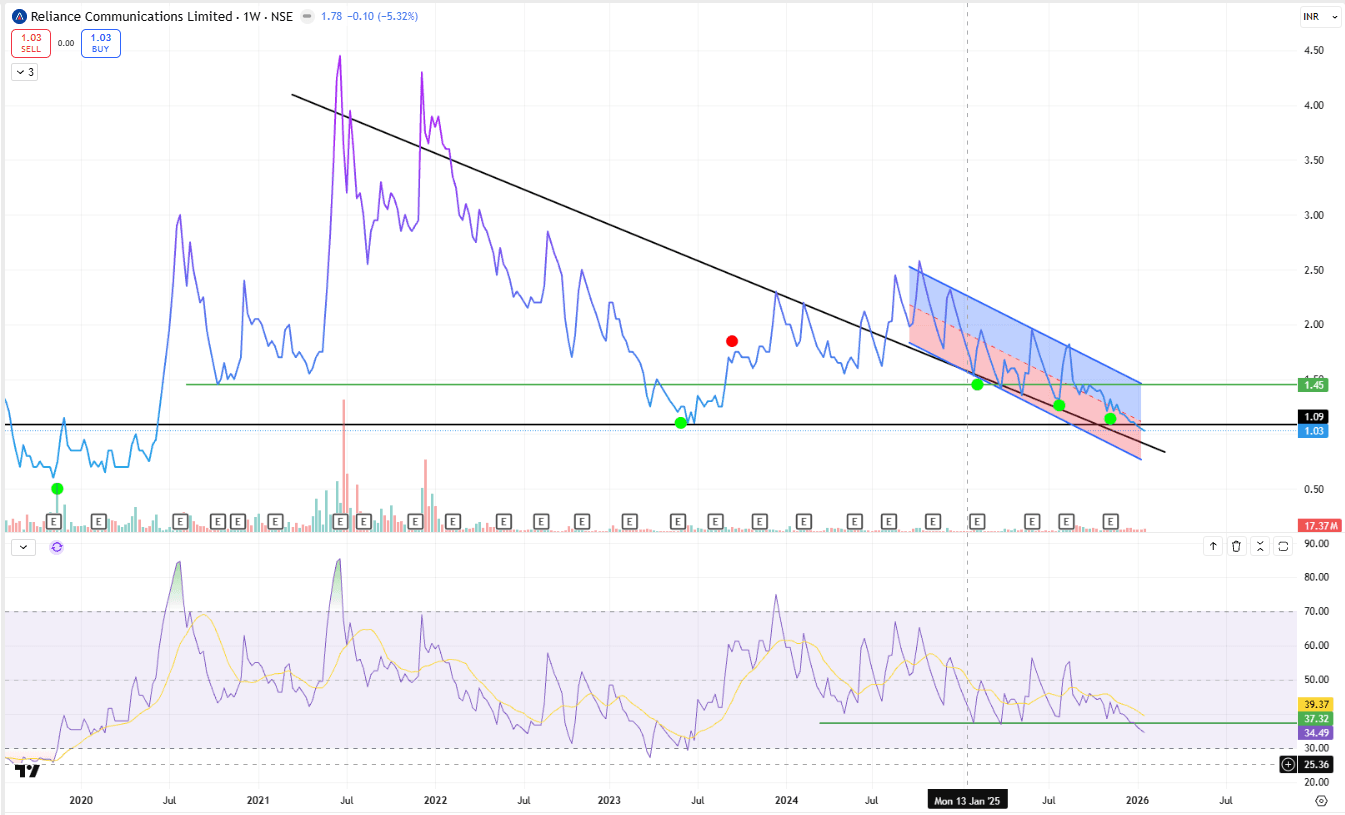
Reliance Communications Limited – Weekly Downtrend Compression Near Long-Term Base

Daily Index View : NIFTY50 as on 23/01/2026
🎯 Market Surface : Intraday Prospective 🚨 Current Market Trend: Negative 📉 - Probability -10% 🔍 Key Level to Watch: 25319 🔄 Current Market Surface: The trend will stay negative until the market stay below 25319 That’s…
Daily Index View : BANKNIFTY as on 23/01/2026
🎯 Market Surface : Intraday Prospective 🚨 Current Market Trend: Negative 📉 - Probability -10% 🔍 Key Level to Watch: 59258 🔄 Current Market Surface: The trend will stay negative until the market stay below 59258 That’s…
Sensex, Nifty Pare Gains After Hitting Key Levels
Benchmark indices Sensex and Nifty gave up part of their intraday gains on January 16 due to profit booking after a sharp rebound. Caution ahead of major Q3 results
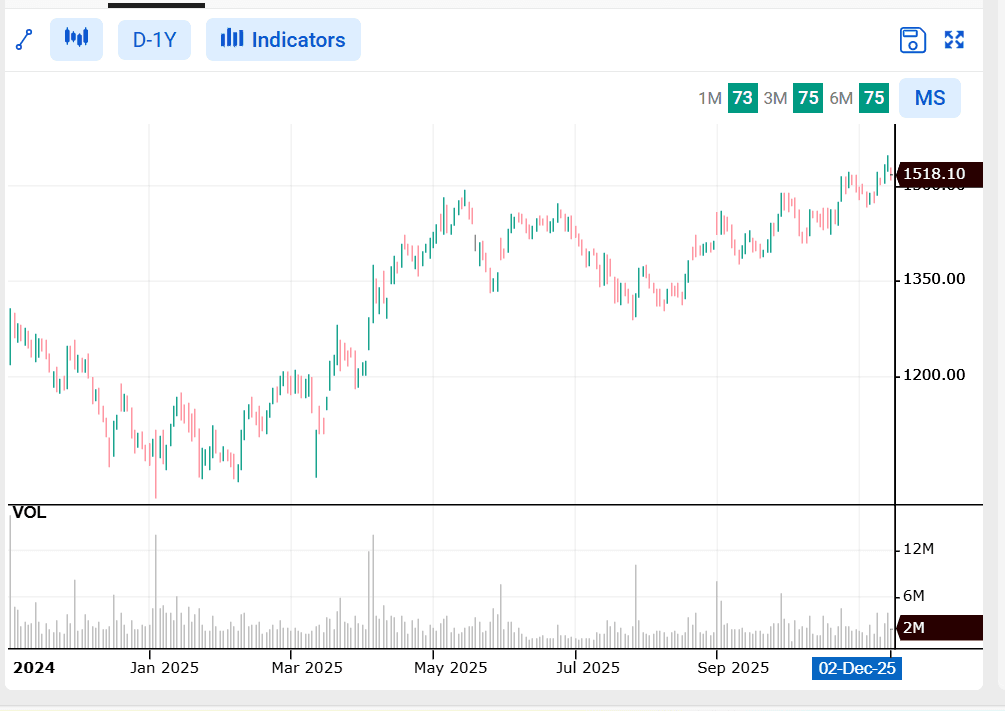
close within 52-week high zone

India has launched its inaugural homegrown high precision compact diode laser, created by Prenishq Pvt Ltd, a spin-off from the Indian Institute of Technology (IIT) Delhi backed by the National Quantum Mission. Unveiled at ESTIC 2025 by Uni…